
Article
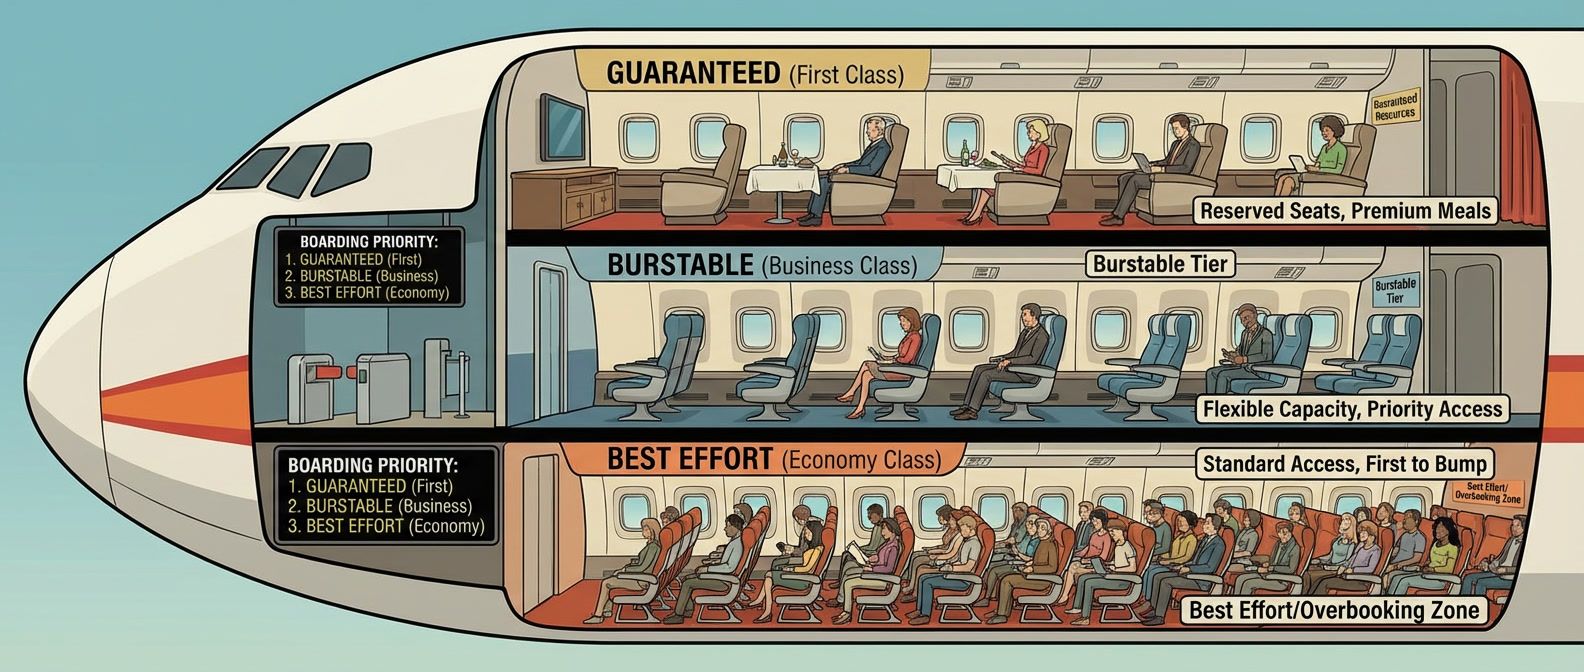
Pod Sizing: Requests, Limits, and QoS Classes
How Kubernetes scheduling and eviction actually work, and how to size pods to survive node pressure.
Learn more
Pull-based metrics collection, PromQL queries, and alerting for Kubernetes stacks
Prometheus is the metrics backbone of most Kubernetes-native observability stacks. Its pull-based scraping model, dimensional data model with labels, and powerful PromQL query language give platform teams the foundation for monitoring infrastructure health, tracking service-level objectives, and powering alerting pipelines. As a CNCF graduated project, it defines the standard that exporters, client libraries, and compatible systems like Thanos and Mimir build against.
For platform engineers, Prometheus work centers on designing a metrics architecture that scales. That means configuring ServiceMonitors and PodMonitors through the Prometheus Operator, setting up federation or remote-write for multi-cluster aggregation, and tuning retention and storage to balance query performance against disk costs. PromQL fluency is essential—writing recording rules that pre-aggregate expensive queries, defining multi-window burn-rate alerts for SLO monitoring, and building dashboards that surface actionable signals instead of vanity metrics.
The operational challenge is cardinality. Every unique combination of metric name and label values creates a time series, and unbounded labels from request paths, user IDs, or pod names can explode storage and query latency. Platform teams that enforce labeling conventions, set per-tenant series limits, and instrument cardinality dashboards keep Prometheus healthy. Those that skip cardinality governance learn about it during their next outage investigation when queries time out.
How Kubernetes scheduling and eviction actually work, and how to size pods to survive node pressure.
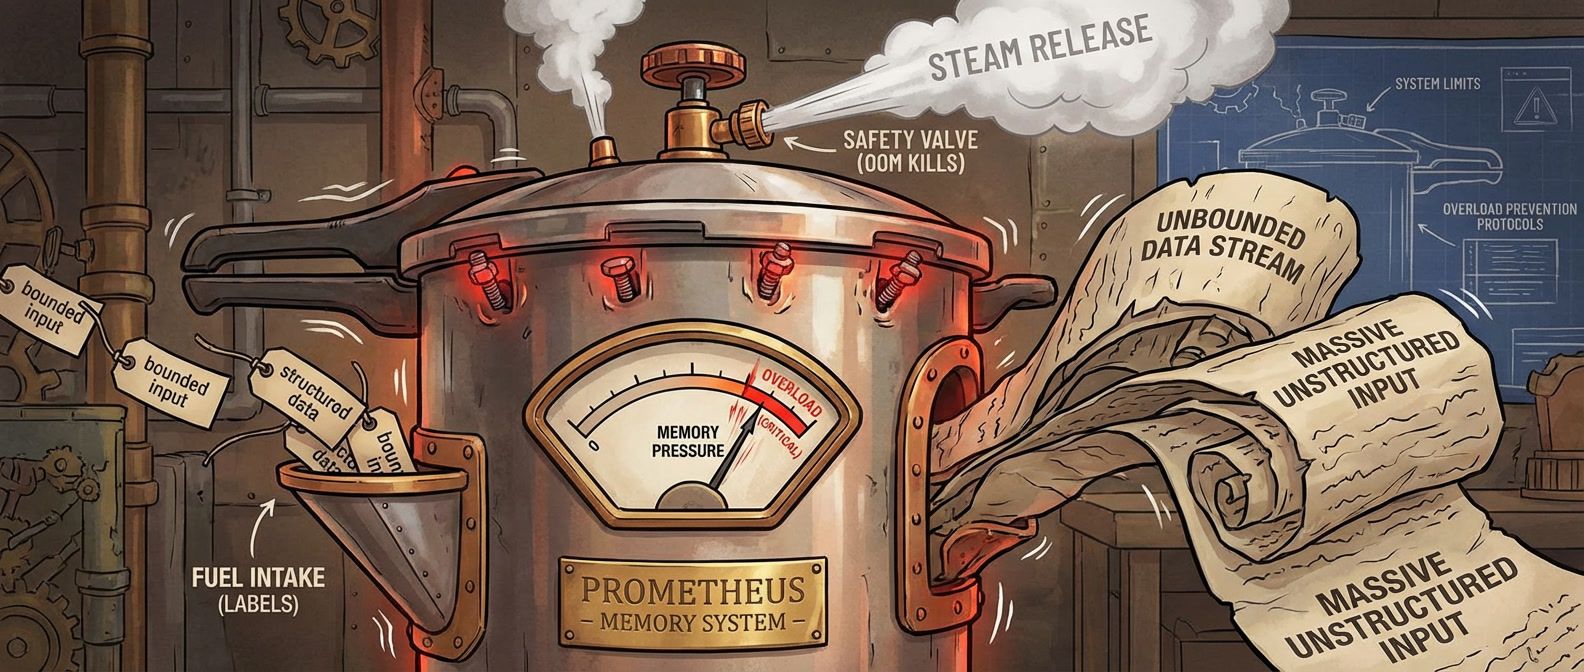
What happens when unbounded label values explode your metrics storage, and how to design around it.

Load shedding, queue depth limits, and admission control that keep systems responsive when overloaded.

Designing catalog schemas with ownership, lifecycle, and dependency data that stays accurate over time.

Field naming, correlation IDs, and noise filtering that keep logs useful as volume grows.

Designing alerts that wake people up for real problems and include runbooks for resolution.