
Backpressure Patterns: Staying Alive Under Load


Table of Contents
Most systems don’t fail because they can’t handle load. They fail because they try to handle all the load. Without explicit overload handling, a system accepts work it cannot complete, queues grow unbounded, latency spikes, timeouts cascade, and what could have been a recoverable traffic spike becomes a prolonged outage.
I watched this happen to an e-commerce platform during a flash sale. Traffic spiked to 10x normal within minutes. The system accepted every request — that was the problem. Database connections exhausted. Response times climbed from 200ms to 30 seconds. Clients started timing out and retrying, which doubled the load again. The operations team tried scaling up, but new instances couldn’t get database connections either. What could have been a 15-minute degradation became a 4-hour outage that required a full restart to clear the request backlog.
The fix wasn’t more capacity. It was teaching the system to say “no.”
Backpressure is a survival mechanism. It’s the ability to signal upstream that you’re overwhelmed and cannot accept more work right now. Done well, it keeps your system responsive at capacity while gracefully degrading beyond it. Done poorly — or not at all — your system accepts work until it collapses.
A system without backpressure will accept work until it collapses. The goal is not to handle unlimited load — it’s to handle your design capacity reliably and degrade gracefully beyond it.
Understanding Overload
The Anatomy of Cascading Failure
Overload doesn’t just make systems slow — it makes them worse. There’s a vicious cycle at work: load increases, latency increases, clients timeout, clients retry, and now you have even more load. What started as a 2x traffic spike becomes a 4x spike from retries alone.
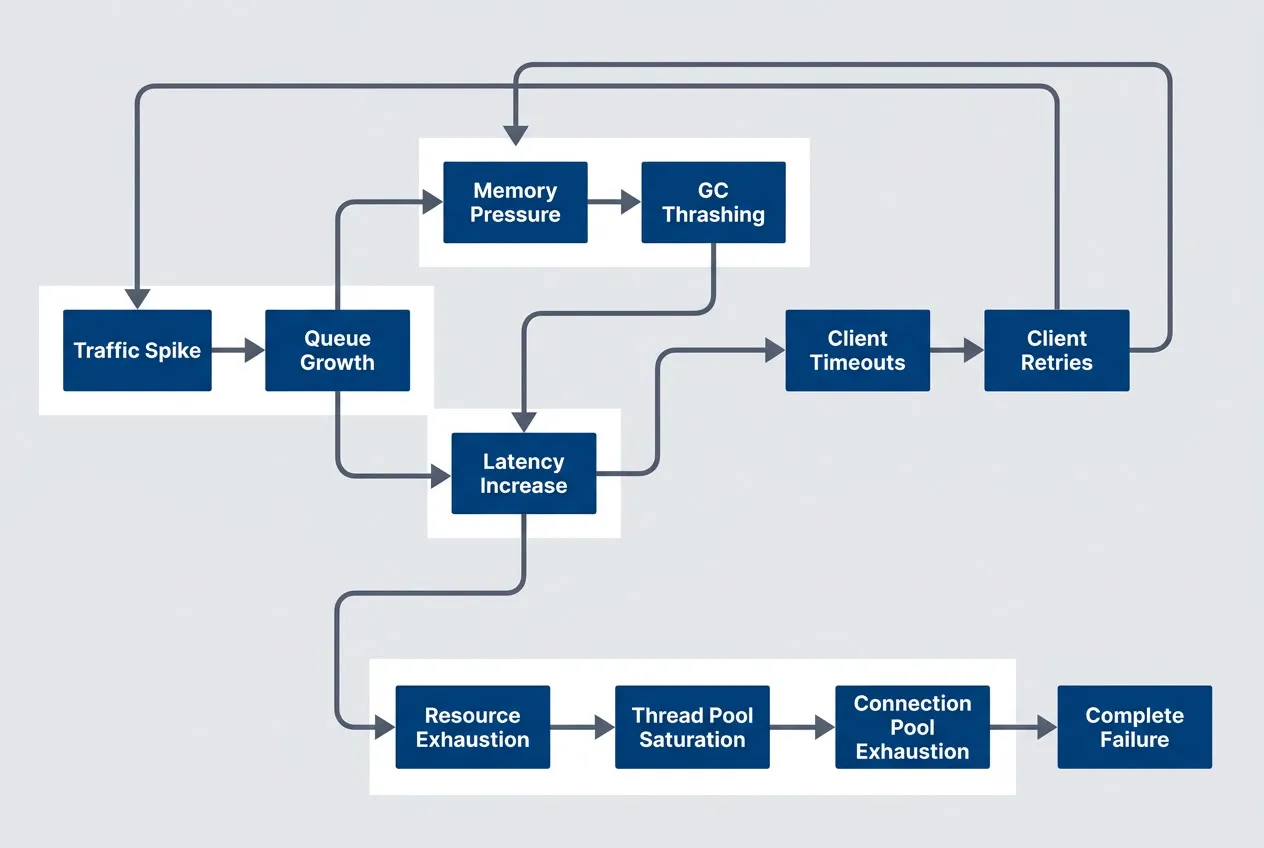
The cascading failure loop where overload compounds itself through retries and resource exhaustiondescription
Flowchart showing how overload amplifies itself into a full outage. A Traffic Spike leads to Queue Growth, which causes Latency Increase. Increased latency causes Client Timeouts, which trigger Client Retries, feeding additional traffic back into the original spike. From Latency Increase, a second branch leads to Resource Exhaustion, then Thread Pool Saturation, then Connection Pool Exhaustion, and finally Complete Failure. A third branch from Queue Growth leads to Memory Pressure, then GC Thrashing, which feeds back into Latency Increase. The diagram shows that retries, exhausted worker resources, and memory pressure can all reinforce each other and make overload worsen instead of stabilizing.
The diagram shows three paths to failure, and they often happen simultaneously. The retry loop is the most insidious — well-intentioned client retry logic turns a temporary overload into a sustained assault. Thread pool saturation means requests that could be processed sit waiting for a worker. And memory pressure from growing queues triggers garbage collection pauses that reduce your effective capacity right when you need it most.
This is why overload tends to get worse rather than self-correcting. Every mechanism designed for reliability under normal conditions — retries, timeouts, connection pooling — becomes a liability under overload.
When you don’t need this: If your system can scale horizontally fast enough to absorb traffic spikes (autoscaling in under 30 seconds, stateless services), you may not need sophisticated backpressure. But most systems have something that doesn’t scale — a database, a third-party API, a license-limited service. That’s where these patterns become essential.
Little’s Law and Queue Theory
There’s a fundamental relationship between throughput, latency, and queue depth that explains why overload causes latency to explode:
Where
This equation is deceptively simple but has profound implications:
Example: System processing 100 RPS with 200ms latency
Queue depth = 100 × 0.2 = 20 requests in flight

Same system under overload: 500 RPS arriving, still processing 100 RPS
Effective latency grows as queue builds
After 1 minute: 24,000 requests queued, latency > 4 minutes
When arrival rate exceeds processing rate, the queue grows without bound. And here’s the cruel part: every request in the queue adds to everyone’s wait time. A request that arrives when 1,000 others are queued will wait for all 1,000 to be processed first. By the time it’s served, the client has likely given up.
Little’s Law explains why overload causes latency to explode. When arrival rate exceeds processing rate, queue depth grows without bound, and every queued request adds to everyone’s wait time.
Goodput vs. Throughput
Here’s a counterintuitive truth: throughput can increase during overload while your system becomes effectively useless. The distinction is between throughput (work attempted) and goodput (work successfully completed).
| Metric | Definition | Under Normal Load | Under Overload |
|---|---|---|---|
| Goodput | Successful responses | 1000 RPS | 400 RPS |
| Throughput | Requests processed | 1000 RPS | 1200 RPS |
| Badput | Failed/timed out | 0 RPS | 800 RPS |
Under overload, your system might process more requests than ever — but most of that work is wasted. Requests timeout after consuming resources. Database queries complete but the client already gave up. Retries succeed but the original request already errored out.
This is the key insight: if you’d simply rejected 1,000 of those 2,000 requests immediately, you could have successfully served the other 1,000. Instead, by accepting all of them, you served only 400. Fast rejection is better than slow failure.
Backpressure Mechanisms
What Is Backpressure?
Backpressure is the propagation of flow control signals from consumers back to producers. When a downstream component is overwhelmed, it signals upstream to slow down. The signal travels backward through the system until it reaches something that can actually reduce the load — usually the client.
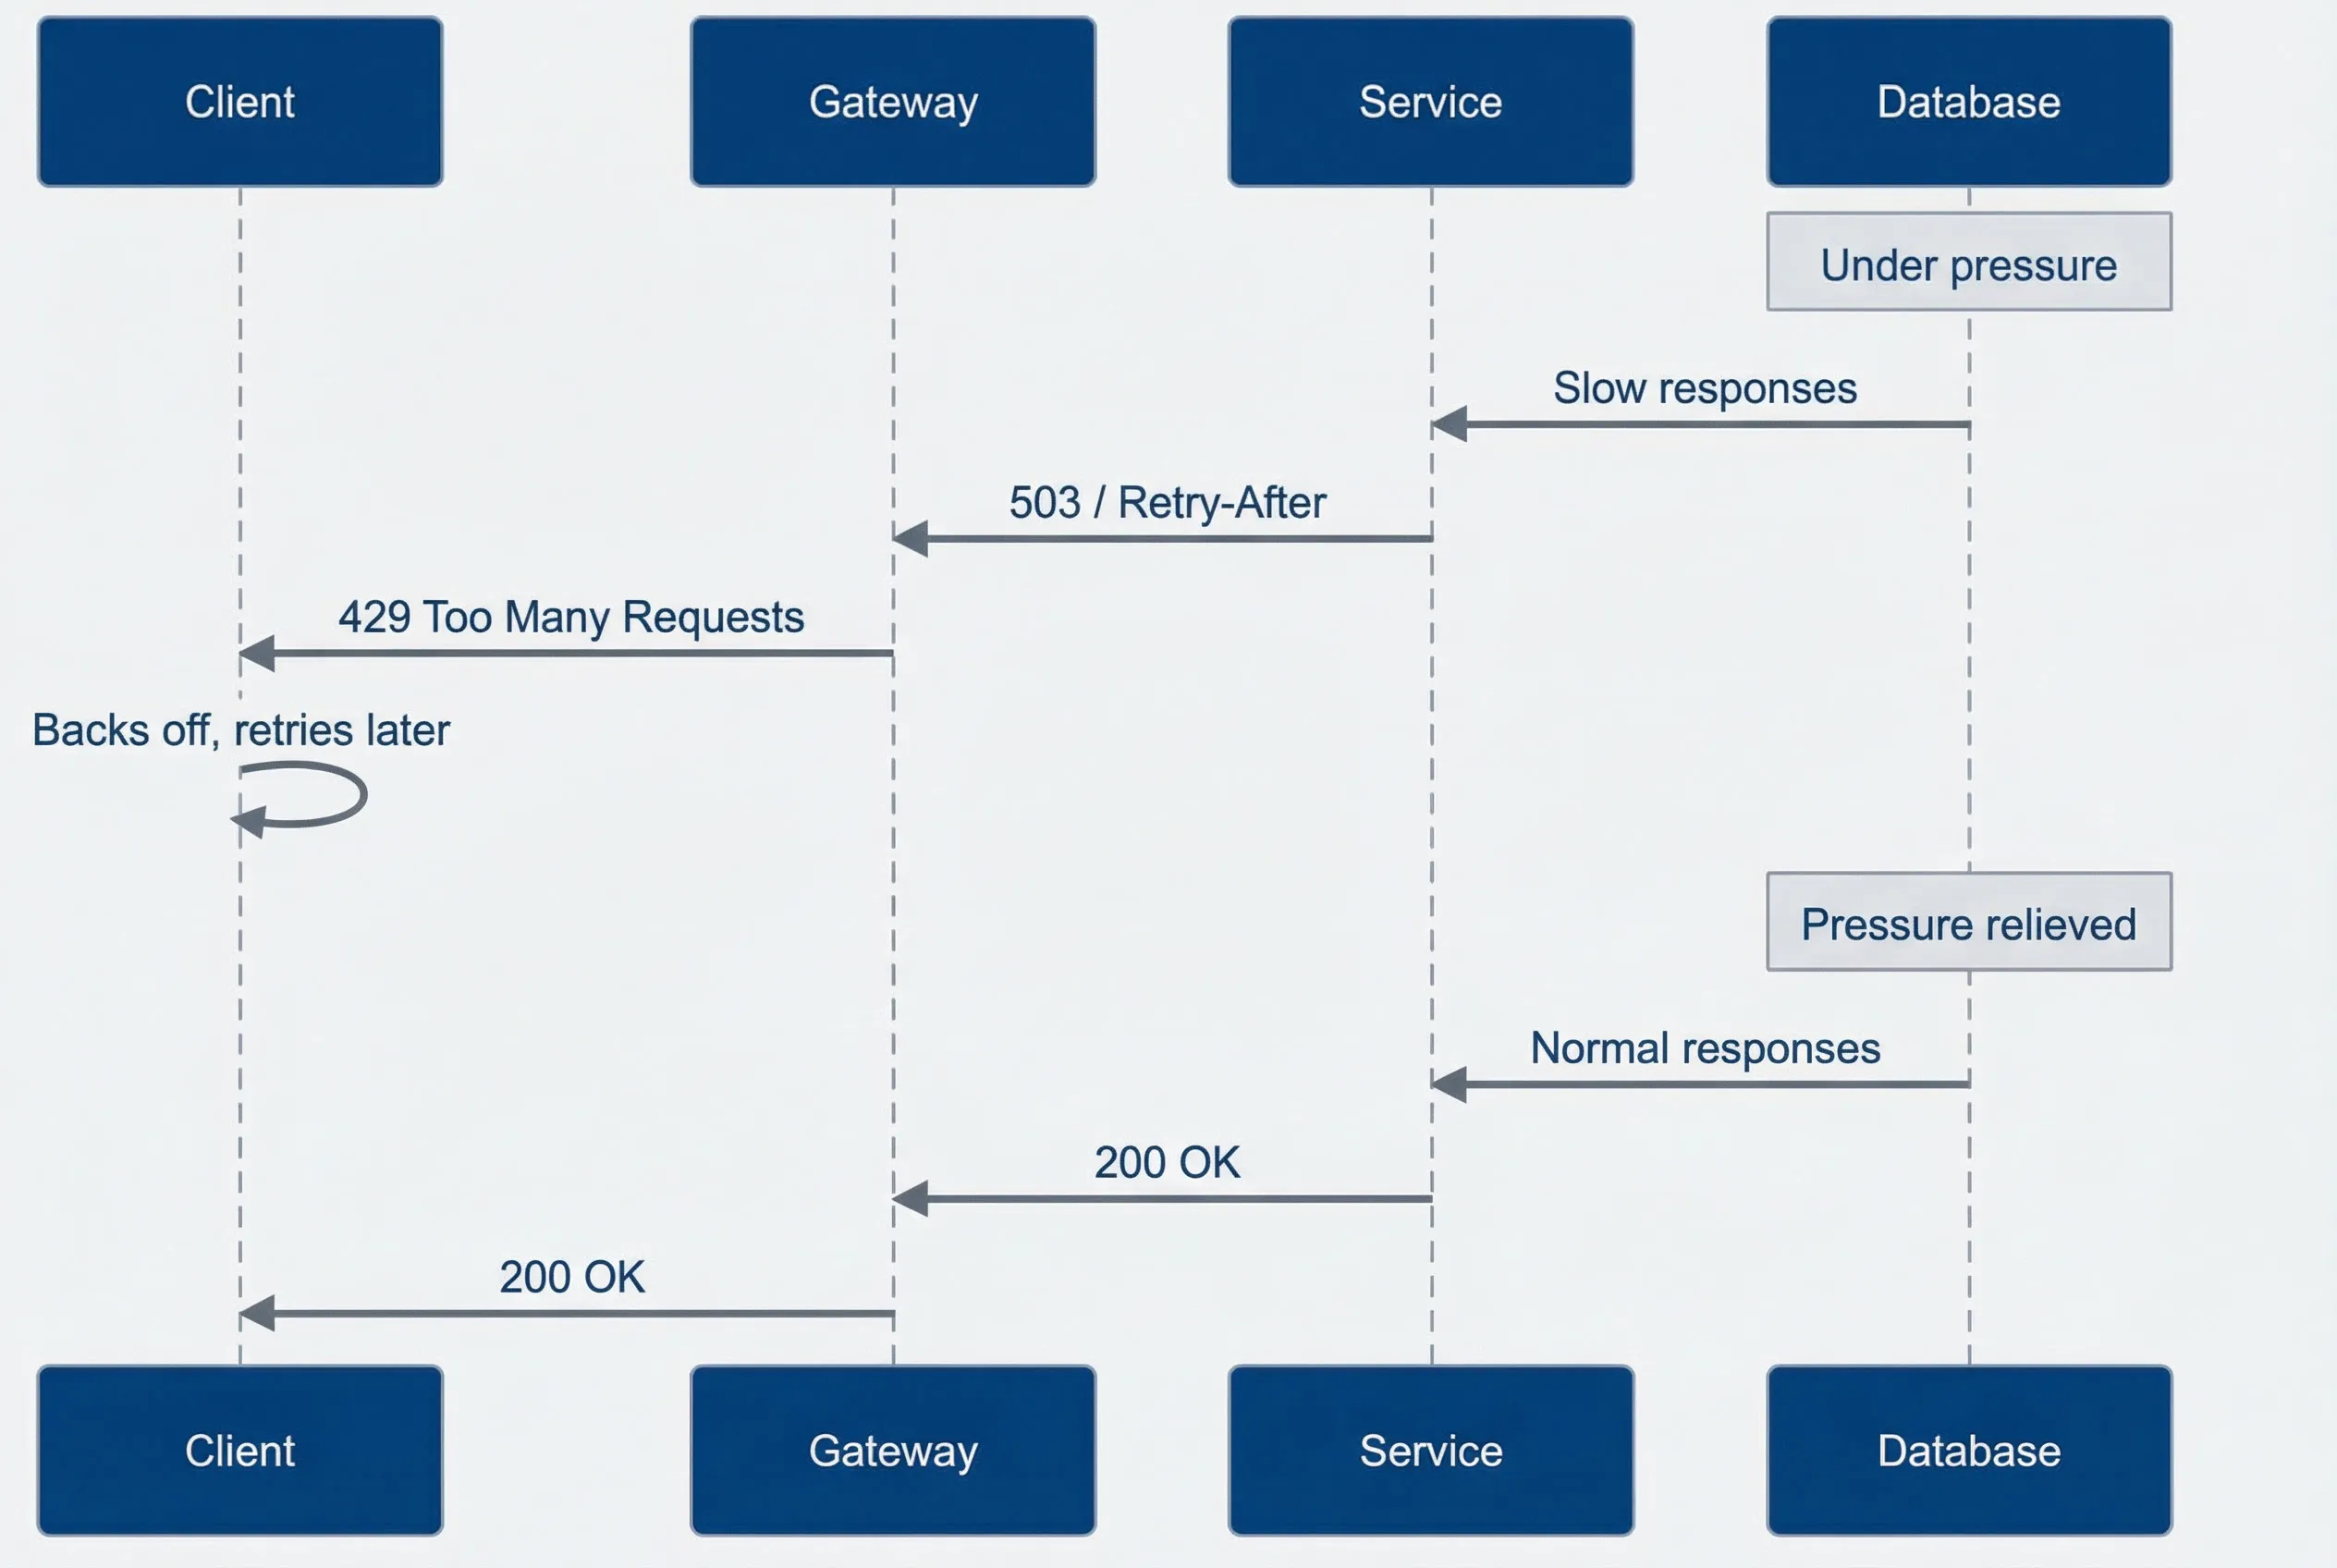
Backpressure propagates from the constrained resource back to the clientdescription
Sequence diagram showing overload signals moving backward through a request path. The participants are Client, Gateway, Service, and Database. While the Database is under pressure, it responds slowly to the Service. The Service returns 503 with Retry-After to the Gateway, which returns 429 Too Many Requests to the Client. The Client then backs off and retries later. After pressure is relieved, the Database returns normal responses to the Service, the Service returns 200 OK to the Gateway, and the Gateway returns 200 OK to the Client. The diagram illustrates that effective backpressure starts where capacity is constrained and propagates upstream until the client reduces demand.
The key principle I keep coming back to: you can’t process your way out of overload. The only thing that actually reduces load is getting clients to send fewer requests. Backpressure is the mechanism that makes that happen.
Explicit vs. Implicit Backpressure
I’ve seen several ways to signal overload, each with different tradeoffs:
| # | Type | Mechanism | Example | Pros | Cons |
|---|---|---|---|---|---|
| 1 | Explicit | Protocol-level signals | HTTP 429, TCP flow control | Clear signal, client can react | Requires client cooperation |
| 2 | Implicit | Increased latency | Slow responses | No implementation needed | Clients may not notice, retry |
| 3 | Connection-based | Refuse connections | Connection limits | Hard boundary | Poor client experience |
| 4 | Queue-based | Bounded queues | Reject when full | Predictable latency | Work is lost |
Explicit backpressure is almost always better than implicit. When you return a slow response, clients don’t know if you’re overloaded or just processing a complex request. They might retry, making things worse. When you return a 429 with a Retry-After header, the signal is unambiguous: “I’m busy, come back in 30 seconds.”
TCP Flow Control as Inspiration
TCP solved the backpressure problem decades ago. Its flow control mechanism provides a model worth studying:
TCP Flow Control:
- 1Receiver advertises window size:It tells the sender how much data it can accept.
- 2Sender limits in-flight data:It caps in-flight data at the advertised window size.
- 3As receiver processes data:The available window opens again.
- 4If receiver is slow:The window can shrink to zero, which creates backpressure.
Application equivalent:
- 1Service advertises capacity:It communicates capacity through rate limits and queue depth.
- 2Clients limit concurrent requests:They keep concurrency within that advertised capacity.
- 3As service recovers:Available capacity opens back up.
- 4If service is slow:Clients back off and send less work.
The elegance of TCP’s approach is that backpressure is automatic. The receiver doesn’t have to decide when to apply pressure — the window size naturally reflects its processing capacity. Application-level backpressure often requires more explicit coordination, but the principle is the same: consumers must be able to tell producers “slow down.”
Admission Control
The Bouncer Pattern
Think of admission control like a nightclub bouncer. The bouncer’s job isn’t to throw people out after they’re inside causing trouble — it’s to decide at the door who gets in. If the club is at capacity, new arrivals wait outside. The people inside have a good experience because it’s not overcrowded.
Admission control works the same way: decide upfront whether to accept work, rather than accepting everything and failing later. A request rejected at the door costs almost nothing. A request that gets halfway through your system before timing out has consumed database connections, CPU cycles, and memory — resources that could have served requests you could complete.
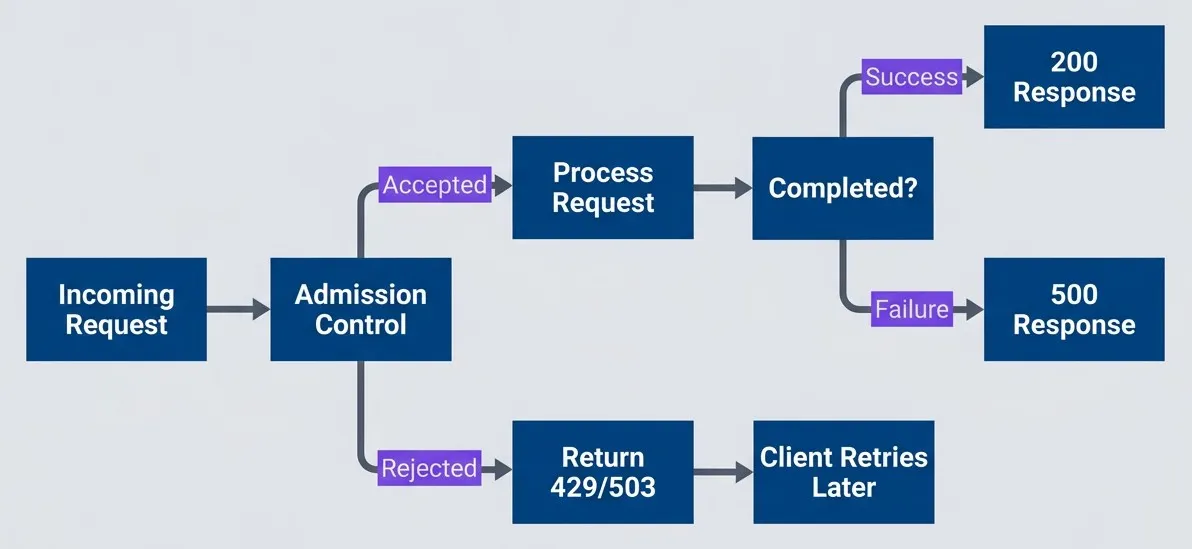
Admission control rejects work at the door rather than accepting and failingdescription
Flowchart showing the admission control decision at request entry. An Incoming Request reaches a decision point labeled Admission Control. If accepted, it moves to Process Request and then to a Completed decision. A successful completion returns 200 Response, while an unsuccessful one returns 500 Response. If rejected at admission, the request immediately returns 429 or 503 and leads to Client Retries Later. The diagram highlights the benefit of deciding early whether the system can accept more work instead of letting requests consume scarce resources before failing.
It’s better to reject 20% of requests immediately than to accept 100% and fail 40% after wasting resources on them. Fast rejection preserves capacity for requests you can actually serve.
Admission Control Strategies
I’ve found several approaches to deciding which requests to admit, each with different tradeoffs:
interface AdmissionController {
  shouldAdmit(request: Request): boolean;
}

// Strategy 1: Simple rate limiting
// Allows N requests per second, rejects the rest
class RateLimitAdmission implements AdmissionController {
  private tokens: number;
  private readonly maxTokens: number;
  private readonly refillRate: number;

  shouldAdmit(request: Request): boolean {
    if (this.tokens > 0) {
      this.tokens--;
      return true;
    }
    return false;
  }
}

// Strategy 2: Concurrency limiting
// Allows N requests in-flight simultaneously
class ConcurrencyAdmission implements AdmissionController {
  private inFlight: number = 0;
  private readonly maxConcurrent: number;

  shouldAdmit(request: Request): boolean {
    if (this.inFlight < this.maxConcurrent) {
      this.inFlight++;
      return true;
    }
    return false;
  }
}

// Strategy 3: Latency-based (adaptive)
// Rejects more aggressively as latency increases
class LatencyAdmission implements AdmissionController {
  private recentLatencies: number[] = [];
  private readonly targetLatency: number;

  shouldAdmit(request: Request): boolean {
    const p99 = this.calculateP99();
    const admitProbability = this.targetLatency / Math.max(p99, this.targetLatency);
    return Math.random() < admitProbability;
  }
}

// Strategy 4: Queue depth based
// Rejects when queue exceeds threshold
class QueueDepthAdmission implements AdmissionController {
  private queueDepth: number = 0;
  private readonly maxQueueDepth: number;

  shouldAdmit(request: Request): boolean {
    return this.queueDepth < this.maxQueueDepth;
  }
}<?php
namespace App\Http\Middleware;
use Closure;
use Illuminate\Http\Request;
use Illuminate\Support\Facades\Cache;
use Illuminate\Support\Facades\Redis;
use Symfony\Component\HttpFoundation\Response;
interface AdmissionController
{
public function shouldAdmit(Request $request): bool;
}
// Strategy 1: Simple rate limiting
// Allows N requests per second, rejects the rest
class RateLimitAdmission implements AdmissionController
{
public function __construct(
private int $maxTokens,
private float $refillRate,
private string $key = 'rate_limit'
) {}
public function shouldAdmit(Request $request): bool
{
return Redis::throttle($this->key)
->allow($this->maxTokens)
->every(1 / $this->refillRate)
->then(
fn () => true,
fn () => false
);
}
}
// Strategy 2: Concurrency limiting
// Allows N requests in-flight simultaneously
class ConcurrencyAdmission implements AdmissionController
{
public function __construct(
private int $maxConcurrent,
private string $key = 'concurrency_limit'
) {}
public function shouldAdmit(Request $request): bool
{
$inFlight = (int) Redis::get($this->key) ?? 0;
if ($inFlight < $this->maxConcurrent) {
Redis::incr($this->key);
return true;
}
return false;
}
public function release(): void
{
Redis::decr($this->key);
}
}
// Strategy 3: Latency-based (adaptive)
// Rejects more aggressively as latency increases
class LatencyAdmission implements AdmissionController
{
public function __construct(
private float $targetLatencyMs,
private string $key = 'latencies'
) {}
public function shouldAdmit(Request $request): bool
{
$p99 = $this->calculateP99();
$admitProbability = $this->targetLatencyMs / max($p99, $this->targetLatencyMs);
return (mt_rand() / mt_getrandmax()) < $admitProbability;
}
public function recordLatency(float $latencyMs): void
{
Redis::lpush($this->key, $latencyMs);
Redis::ltrim($this->key, 0, 999); // Keep last 1000 samples
}
private function calculateP99(): float
{
$latencies = Redis::lrange($this->key, 0, -1);
if (empty($latencies)) {
return $this->targetLatencyMs;
}
$latencies = array_map('floatval', $latencies);
sort($latencies);
$index = (int) (count($latencies) * 0.99);
return $latencies[min($index, count($latencies) - 1)];
}
}
// Strategy 4: Queue depth based
// Rejects when queue exceeds threshold
class QueueDepthAdmission implements AdmissionController
{
public function __construct(
private int $maxQueueDepth,
private string $queueName = 'default'
) {}
public function shouldAdmit(Request $request): bool
{
$queueDepth = Redis::llen("queues:{$this->queueName}");
return $queueDepth < $this->maxQueueDepth;
}
}
// Laravel middleware combining strategies
class AdmissionControlMiddleware
{
public function __construct(
private AdmissionController $controller
) {}
public function handle(Request $request, Closure $next): Response
{
if (!$this->controller->shouldAdmit($request)) {
return response()->json([
'error' => 'service_unavailable',
'message' => 'Server is at capacity, please retry later',
], 503)->withHeaders([
'Retry-After' => 30,
]);
}
return $next($request);
}
}from abc import ABC, abstractmethod
from dataclasses import dataclass, field
import random
import time
from typing import Any
class AdmissionController(ABC):
@abstractmethod
def should_admit(self, request: Any) -> bool:
pass
# Strategy 1: Simple rate limiting
# Allows N requests per second, rejects the rest
@dataclass
class RateLimitAdmission(AdmissionController):
max_tokens: int
refill_rate: float # tokens per second
_tokens: float = field(init=False)
_last_refill: float = field(init=False)
def __post_init__(self):
self._tokens = float(self.max_tokens)
self._last_refill = time.monotonic()
def should_admit(self, request: Any) -> bool:
self._refill()
if self._tokens >= 1:
self._tokens -= 1
return True
return False
def _refill(self):
now = time.monotonic()
elapsed = now - self._last_refill
self._tokens = min(self.max_tokens, self._tokens + elapsed * self.refill_rate)
self._last_refill = now
# Strategy 2: Concurrency limiting
# Allows N requests in-flight simultaneously
@dataclass
class ConcurrencyAdmission(AdmissionController):
max_concurrent: int
_in_flight: int = field(default=0, init=False)
def should_admit(self, request: Any) -> bool:
if self._in_flight < self.max_concurrent:
self._in_flight += 1
return True
return False
def release(self):
self._in_flight = max(0, self._in_flight - 1)
# Strategy 3: Latency-based (adaptive)
# Rejects more aggressively as latency increases
@dataclass
class LatencyAdmission(AdmissionController):
target_latency_ms: float
_recent_latencies: list[float] = field(default_factory=list, init=False)
def should_admit(self, request: Any) -> bool:
p99 = self._calculate_p99()
admit_probability = self.target_latency_ms / max(p99, self.target_latency_ms)
return random.random() < admit_probability
def record_latency(self, latency_ms: float):
self._recent_latencies.append(latency_ms)
# Keep only recent samples
if len(self._recent_latencies) > 1000:
self._recent_latencies = self._recent_latencies[-1000:]
def _calculate_p99(self) -> float:
if not self._recent_latencies:
return self.target_latency_ms
sorted_latencies = sorted(self._recent_latencies)
index = int(len(sorted_latencies) * 0.99)
return sorted_latencies[min(index, len(sorted_latencies) - 1)]
# Strategy 4: Queue depth based
# Rejects when queue exceeds threshold
@dataclass
class QueueDepthAdmission(AdmissionController):
max_queue_depth: int
_queue_depth: int = field(default=0, init=False)
def should_admit(self, request: Any) -> bool:
return self._queue_depth < self.max_queue_depth
def enqueue(self):
self._queue_depth += 1
def dequeue(self):
self._queue_depth = max(0, self._queue_depth - 1)Rate limiting is the simplest — it caps throughput regardless of what the system can actually handle. Concurrency limiting is better because it naturally adapts: if requests are fast, you can serve more per second; if they’re slow, you serve fewer but don’t overload. Latency-based admission is the most sophisticated — it directly targets the metric you care about (response time) and adjusts admission probability based on observed behavior.
Priority-Based Admission
Not all requests are equal. During overload, you want to protect critical traffic — health checks, payment processing, authenticated users — while shedding less important work. Priority-based admission reserves capacity for high-priority requests.
# AWS ALB listener rules with priority-based routing
# Higher priority numbers = lower precedence
Rules:
  - Priority: 1
    Conditions:
      - Field: path-pattern
        Values: ["/health", "/api/payments/*"]
    Actions:
      - Type: forward
        TargetGroupArn: !Ref CriticalTargetGroup

  - Priority: 10
    Conditions:
      - Field: http-header
        HttpHeaderConfig:
          HttpHeaderName: Authorization
          Values: ["Bearer *"]
    Actions:
      - Type: forward
        TargetGroupArn: !Ref AuthenticatedTargetGroup

  - Priority: 100
    Conditions:
      - Field: path-pattern
        Values: ["/*"]
    Actions:
      - Type: forward
TargetGroupArn: !Ref AnonymousTargetGroupThe key insight is that critical traffic can borrow capacity from lower tiers. If the anonymous quota is exhausted but the critical quota has room, anonymous requests are rejected while critical requests continue flowing. During severe overload, you shed in reverse priority order: anonymous first, then authenticated, and critical traffic last (or never).
Load Shedding
What to Shed and When
Load shedding is the deliberate dropping of work to preserve system stability. It sounds brutal — and it is — but it’s also essential. When you’re drowning, you throw cargo overboard to keep the ship afloat. The alternative is losing everything.
The key insight is that some work completing successfully is better than all work failing. If your system can handle 1,000 RPS but 2,000 are arriving, you have a choice: accept all 2,000 and watch goodput collapse to 400 (because everything times out), or shed 1,000 immediately and successfully serve the other 1,000.
| # | Shedding Strategy | When to Use | Tradeoff |
|---|---|---|---|
| 1 | Random | Simple implementation | May drop important requests |
| 2 | LIFO (newest first) | Reduce queuing latency | May serve stale requests |
| 3 | FIFO (oldest first) | Likely already timed out | Wasted work on old requests |
| 4 | Priority-based | Protect important traffic | Complexity, starvation risk |
| 5 | Cost-based | Protect expensive operations | Requires cost tracking |
The choice of strategy depends on your workload. Random shedding is the simplest — it’s statistically fair and requires no tracking. But “fair” isn’t always optimal. Sometimes you want to be deliberately unfair to maximize successful completions.
LIFO Shedding: Drop the Newest
Here’s a counterintuitive idea: when you need to shed load, drop the newest requests first, not the oldest. Traditional queuing is FIFO — first in, first out. LIFO shedding inverts this.
Consider a queue with 100 requests where processing takes 100ms each:
FIFO shedding (traditional):
- Request 1 (oldest):
- It waited 10 seconds and will still be served.
- Request 100 (newest):
- It will wait more than 10 seconds and will likely time out.
- Outcome:
- The client likely already gave up on request 1, so the work was wasted.
LIFO shedding (counterintuitive but effective):
- Request 100 (newest):
- It is rejected immediately, so the client can retry.
- Request 1 (oldest):
- It is served, but the client may already have given up.
- Better:
- A CoDel-style approach considers wait time before dropping work.
The logic is this: a request that just arrived and gets rejected immediately can be retried right away. The client is still waiting, the context is still fresh. A request that waited 30 seconds in a queue and finally gets served? That client probably gave up long ago. The response goes nowhere. You did all that work for nothing.
LIFO shedding sounds unfair but often produces better outcomes. A request that just arrived and gets rejected can be retried immediately. A request that waited 30 seconds and finally gets served may find the client already gave up.
CoDel: Controlled Delay
Neither pure FIFO nor LIFO is ideal. What we really want is to drop requests that have already waited too long—requests whose clients have likely given up. This is exactly what CoDel (Controlled Delay) does.
CoDel was originally designed for network routers, but its principles apply perfectly to application queues. The algorithm tracks “sojourn time”—how long each item has been in the queue. If sojourn time stays below a target (say, 5ms), the queue is healthy. If it stays above the target for an entire interval (say, 100ms), CoDel starts dropping.
The clever part is how it drops. Rather than dropping everything, CoDel drops at an accelerating rate proportional to the square root of how many consecutive drops have occurred. This creates just enough backpressure to bring the queue under control without overreacting.
// CoDel queue for use as a WASM filter in Envoy — either as
// reverse proxy/API gateway middleware or service mesh sidecar.

package codel

import (
  "math"
  "time"
)

type CoDelConfig struct {
  TargetDelay time.Duration // Target queuing delay (e.g., 5ms)
  Interval    time.Duration // Observation interval (e.g., 100ms)
}

type entry[T any] struct {
  item        T
  enqueueTime time.Time
}

type CoDelQueue[T any] struct {
  config         CoDelConfig
  queue          []entry[T]
  dropping       bool
  firstAboveTime time.Time
  dropNext       time.Time
  count          int
}

func (q *CoDelQueue[T]) Enqueue(item T) {
  q.queue = append(q.queue, entry[T]{
    item:        item,
    enqueueTime: time.Now(),
  })
}

func (q *CoDelQueue[T]) Dequeue() (T, bool) {
  var zero T
  if len(q.queue) == 0 {
    return zero, false
  }

  e := q.queue[0]
  q.queue = q.queue[1:]
  sojournTime := time.Since(e.enqueueTime)

  if sojournTime < q.config.TargetDelay {
    // Queue delay is acceptable
    q.firstAboveTime = time.Time{}
    q.dropping = false
    return e.item, true
  }

  // Queue delay exceeds target
  if q.firstAboveTime.IsZero() {
    q.firstAboveTime = time.Now()
  } else if time.Since(q.firstAboveTime) > q.config.Interval {
    // Been above target for too long, start dropping
    q.dropping = true
    q.count++
    q.dropNext = time.Now().Add(
      time.Duration(float64(q.config.Interval) / math.Sqrt(float64(q.count))),
    )
  }

  if q.dropping && time.Now().After(q.dropNext) {
    // Drop this item and schedule next drop
    q.count++
    q.dropNext = time.Now().Add(
      time.Duration(float64(q.config.Interval) / math.Sqrt(float64(q.count))),
    )
    return zero, false // Dropped
  }

  return e.item, true
}The beauty of CoDel is that it’s self-tuning. During normal operation, it never drops anything. When overload hits, it drops just enough to keep latency bounded. When overload subsides, it automatically stops dropping. No manual tuning of drop rates required.
Graceful Degradation Tiers
Load shedding doesn’t have to be all-or-nothing. A smarter approach is graceful degradation: as load increases, progressively disable non-essential features to preserve capacity for what matters.
Think of it like a submarine diving deeper. At each depth threshold, you seal off another compartment. The ship loses functionality but gains survivability. At maximum depth, only the core systems remain operational — but the ship is still alive.
# Feature flags for use with LaunchDarkly, Unleash, Flagsmith, or similar.
# Application code checks load metrics against thresholds at runtime
# and toggles features on / off accordingly to conserve resources.
degradation_tiers:
  normal:
    trigger: "load < 80%"
    recover_at: "load < 80%"  # No hysteresis at baseline
    features_enabled:
      - full_search_results
      - personalized_recommendations
      - real_time_analytics
      - detailed_error_messages

  elevated:
    trigger: "load >= 80%"
    recover_at: "load < 70%"  # Hysteresis: enter at 80%, exit at 70%
    features_disabled:
      - personalized_recommendations
    features_degraded:
      - search_results: 10  # Reduced from default
    features_enabled:
      - basic_search
      - cached_recommendations
      - delayed_analytics

  critical:
    trigger: "load >= 90%"
    recover_at: "load < 80%"  # Hysteresis
    features_disabled:
      - search
      - analytics
      - personalized_recommendations
    features_enabled:
      - core_transactions_only
      - static_content
      - essential_apis_only

  emergency:
    trigger: "load >= 95%"
    recover_at: "load < 90%"  # Hysteresis
    features_disabled:
      - anonymous_traffic
      - non_critical_apis
    features_enabled:
      - authenticated_users_only
      - payment_processing
- health_endpointsNotice the hysteresis in the diagram below — the thresholds to recover are lower than the thresholds to degrade. You enter “elevated” at 80% but don’t return to “normal” until you’re below 70%. This prevents oscillation. Without hysteresis, a system hovering around 80% would constantly flip between normal and elevated, which is worse than staying in one state.
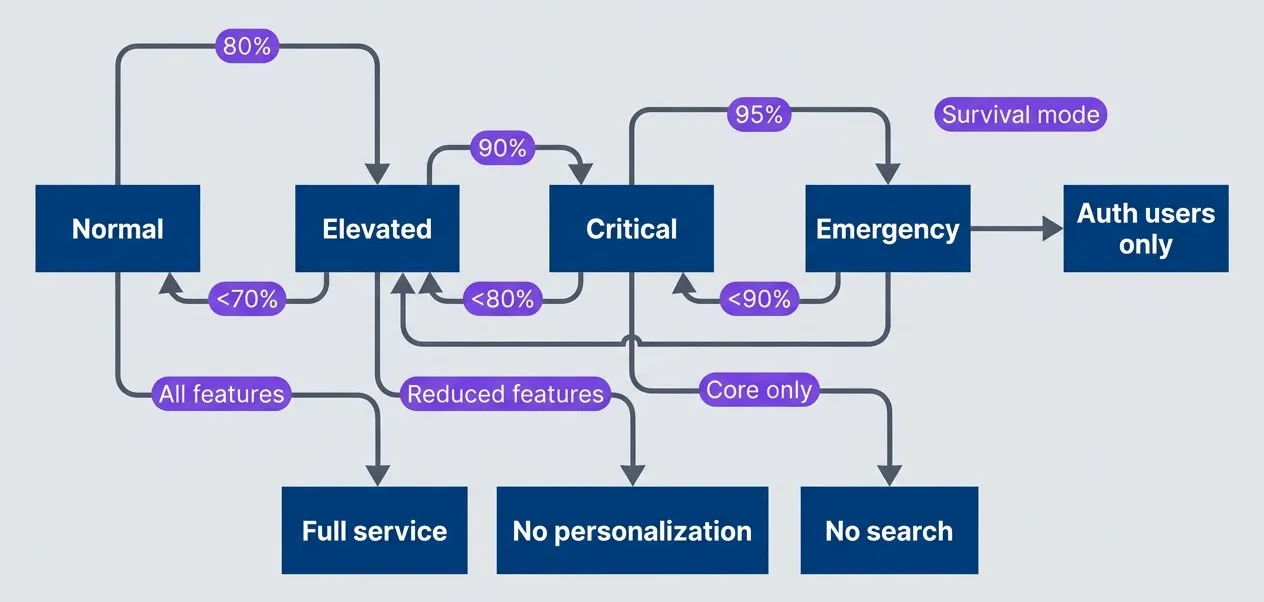
Degradation tiers with hysteresis to prevent oscillationdescription
Flowchart showing four operating states with different entry and recovery thresholds. Normal transitions to Elevated at 80 percent load, Elevated transitions to Critical at 90 percent, and Critical transitions to Emergency at 95 percent. Recovery uses lower thresholds: Emergency returns to Critical below 90 percent, Critical returns to Elevated below 80 percent, and Elevated returns to Normal below 70 percent. Dotted annotations show the user-facing behavior of each state: Normal provides full service, Elevated removes personalization, Critical disables search and keeps only core behavior, and Emergency serves authenticated users only. The diagram illustrates hysteresis by making recovery thresholds lower than degradation thresholds to avoid rapid oscillation between states.
Graceful degradation requires knowing which features are expendable. Work with product owners to classify features into tiers before an incident. During an outage is the wrong time to debate whether search is more important than recommendations.
Client Communication
HTTP Status Codes for Overload
Backpressure only works if clients understand the signal. HTTP provides specific status codes for communicating overload — use them correctly, and well-behaved clients will back off automatically.
| Status Code | Meaning | When to Use | Client Action |
|---|---|---|---|
| 429 | Too Many Requests | Rate limit exceeded | Back off, retry with delay |
| 503 | Service Unavailable | Temporary overload | Retry after delay |
| 504 | Gateway Timeout | Upstream timeout | May retry |
| 507 | Insufficient Storage | Queue/buffer full | Reduce request rate |
The distinction between 429 and 503 matters. A 429 says “you specifically are sending too many requests”—it’s a per-client signal. A 503 says “the service is overwhelmed regardless of who’s asking”—it’s a global signal. Rate limiters return 429; admission control during overload returns 503.
Avoid returning 500 for overload conditions. A 500 suggests a bug — something the client can’t fix by waiting. Clients may not retry 500s, or may retry them aggressively assuming it’s a transient glitch. Be explicit: if the problem is capacity, say so with 429 or 503.
Retry-After Header
The Retry-After header tells clients exactly how long to wait before trying again. Without it, clients are guessing — and they’ll usually guess too short, creating a thundering herd when they all retry simultaneously.
import { Request, Response, NextFunction } from 'express';

interface OverloadState {
  isOverloaded: boolean;
  estimatedRecoverySeconds: number;
  currentLoad: number;
}

function getOverloadState(): OverloadState {
  // Implementation that checks system metrics
  return {
    isOverloaded: true,
    estimatedRecoverySeconds: 30,
    currentLoad: 0.95,
  };
}

function overloadMiddleware(req: Request, res: Response, next: NextFunction) {
  const state = getOverloadState();

  if (!state.isOverloaded) {
    return next();
  }

  // Calculate retry delay based on load
  const retryAfter = Math.min(
    state.estimatedRecoverySeconds,
    Math.ceil(state.currentLoad * 60) // Max 60 seconds
  );

  res.setHeader('Retry-After', retryAfter);
  res.setHeader('X-RateLimit-Remaining', '0');
  res.setHeader('X-RateLimit-Reset', Date.now() + retryAfter * 1000);

  // Include machine-readable details
  res.status(503).json({
    error: 'service_unavailable',
    message: 'Service is temporarily overloaded',
    retry_after: retryAfter,
    details: {
      current_load: state.currentLoad,
      estimated_recovery: `${retryAfter}s`,
    },
  });
}A few implementation notes: the Retry-After value can be either seconds (an integer) or an HTTP date. Seconds is simpler and avoids clock-sync issues. The X-RateLimit-* headers aren’t standardized but are widely understood — include them for clients that check. Always include a JSON body with details; some clients log these for debugging, and it makes your support team’s life easier.
Always include a Retry-After header when returning 429 or 503. Without it, clients have no guidance and may retry immediately, making the overload worse.
Client-Side Backoff Patterns
The server half of backpressure is useless without cooperative clients. A client that ignores 429s and retries immediately is actively making the problem worse. Good clients implement exponential backoff with jitter.
Exponential backoff means each retry waits longer than the last — typically doubling. After 5 retries with a 1-second base, you’re waiting 32 seconds. This naturally spreads out retry storms. Jitter adds randomness to prevent synchronization — without it, 1,000 clients that all failed at the same time will all retry at the same time, recreating the original spike.
interface BackoffConfig {
  initialDelayMs: number;
  maxDelayMs: number;
  multiplier: number;
  jitter: number;  // 0-1, percentage of randomization
}

class ExponentialBackoff {
  private attempt: number = 0;

  constructor(private config: BackoffConfig) {}

  getNextDelay(retryAfterHeader?: string): number {
    // Honor server's Retry-After if provided
    if (retryAfterHeader) {
      const serverDelay = parseInt(retryAfterHeader, 10) * 1000;
      if (!isNaN(serverDelay)) {
        return this.addJitter(serverDelay);
      }
    }

    // Calculate exponential backoff
    const exponentialDelay = this.config.initialDelayMs *
      Math.pow(this.config.multiplier, this.attempt);
    const cappedDelay = Math.min(exponentialDelay, this.config.maxDelayMs);

    this.attempt++;
    return this.addJitter(cappedDelay);
  }

  private addJitter(delay: number): number {
    const jitterRange = delay * this.config.jitter;
    const jitter = (Math.random() - 0.5) * 2 * jitterRange;
    return Math.max(0, delay + jitter);
  }

  reset(): void {
    this.attempt = 0;
  }
}

// Utility
const sleep = (ms: number) => new Promise(resolve => setTimeout(resolve, ms));

// Usage
const backoff = new ExponentialBackoff({
  initialDelayMs: 1000,
  maxDelayMs: 60000,
  multiplier: 2,
  jitter: 0.25,
});

async function fetchWithBackoff(url: string, maxRetries: number = 5) {
  for (let i = 0; i < maxRetries; i++) {
    try {
      const response = await fetch(url);

      if (response.status === 429 || response.status === 503) {
        const retryAfter = response.headers.get('Retry-After');
        const delay = backoff.getNextDelay(retryAfter ?? undefined);
        console.log(`Rate limited, waiting ${delay}ms before retry`);
        await sleep(delay);
        continue;
      }

      backoff.reset();
      return response;
    } catch (error) {
      const delay = backoff.getNextDelay();
      console.log(`Request failed, waiting ${delay}ms before retry`);
      await sleep(delay);
    }
  }

  throw new Error(`Failed after ${maxRetries} retries`);
}
import asyncio
import random
from dataclasses import dataclass, field
import httpx
@dataclass
class BackoffConfig:
initial_delay_ms: float = 1000
max_delay_ms: float = 60000
multiplier: float = 2
jitter: float = 0.25 # 0-1, percentage of randomization
@dataclass
class ExponentialBackoff:
config: BackoffConfig = field(default_factory=BackoffConfig)
_attempt: int = field(default=0, init=False)
def get_next_delay(self, retry_after_header: str | None = None) -> float:
# Honor server's Retry-After if provided
if retry_after_header:
try:
server_delay = int(retry_after_header) * 1000
return self._add_jitter(server_delay)
except ValueError:
pass
# Calculate exponential backoff
exponential_delay = self.config.initial_delay_ms * (
self.config.multiplier ** self._attempt
)
capped_delay = min(exponential_delay, self.config.max_delay_ms)
self._attempt += 1
return self._add_jitter(capped_delay)
def _add_jitter(self, delay: float) -> float:
jitter_range = delay * self.config.jitter
jitter = (random.random() - 0.5) * 2 * jitter_range
return max(0, delay + jitter)
def reset(self) -> None:
self._attempt = 0
# Usage
async def fetch_with_backoff(url: str, max_retries: int = 5) -> httpx.Response:
backoff = ExponentialBackoff()
async with httpx.AsyncClient() as client:
for _ in range(max_retries):
try:
response = await client.get(url)
if response.status_code in (429, 503):
retry_after = response.headers.get("Retry-After")
delay = backoff.get_next_delay(retry_after)
print(f"Rate limited, waiting {delay}ms before retry")
await asyncio.sleep(delay / 1000)
continue
backoff.reset()
return response
except httpx.RequestError:
delay = backoff.get_next_delay()
print(f"Request failed, waiting {delay}ms before retry")
await asyncio.sleep(delay / 1000)
raise Exception(f"Failed after {max_retries} retries")The critical detail: always honor Retry-After when the server provides it. The server knows its load better than your exponential formula. If the server says “wait 30 seconds,” wait 30 seconds — don’t override with your calculated 2-second delay.
If you control both the client and server, you can do better than generic backoff. Have the server return current queue depth or estimated wait time, and let clients make informed decisions about whether to retry or fail fast to the user.
Implementation Patterns
Circuit Breakers for Downstream Protection
Circuit breakers prevent a failing downstream dependency from taking down your entire system. The pattern comes from electrical engineering: when current exceeds safe levels, the breaker trips and stops all current flow, protecting the circuit from damage.
In software, the “current” is requests to a downstream service. When that service starts failing, you don’t want to keep hammering it — that wastes your resources waiting for timeouts and makes the downstream service’s recovery harder. Instead, you “trip” the circuit: stop calling the failing service entirely, fail fast, and return a fallback or cached response.
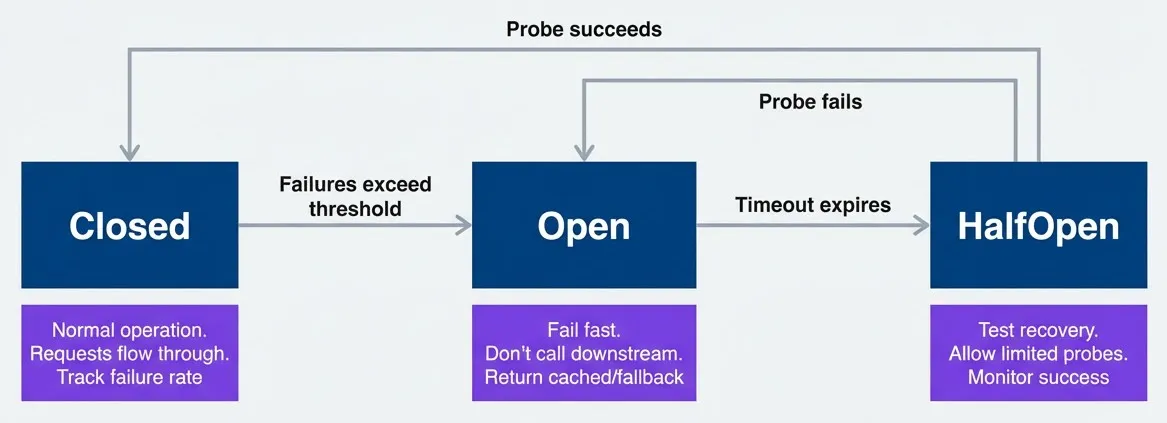
Circuit breaker state machine for downstream protectiondescription
State diagram showing the three standard circuit breaker states. The initial state enters Closed, where normal operation allows requests through and tracks failure rate. If failures exceed the threshold, the breaker moves from Closed to Open. In Open, requests fail fast without calling the downstream dependency and typically return cached or fallback responses. After a timeout expires, the breaker moves from Open to HalfOpen, where a limited number of probe requests are allowed through to test recovery. If a probe succeeds, the breaker returns to Closed. If a probe fails, it goes back to Open. The diagram shows how circuit breakers stop repeated downstream calls during failure and only cautiously resume traffic after recovery signals.
I think of the three states as a conversation between your service and its dependencies. Closed is normal operation where requests flow through and you track failure rates. When failures exceed a threshold, the breaker trips to Open—all requests fail immediately without calling downstream. After a timeout, it transitions to Half-Open, allowing a few probe requests through. If probes succeed, back to Closed; if they fail, back to Open.
// In application code. Gives fine-grained control per operation, not just
// per service. Allows custom fallback logic (return cached data, degraded
// response, etc.). Can protect non-network operations (database queries,
// file I/O). Popular libraries include Opossum (Node), Pybreaker, Gobreaker
enum CircuitState {
  CLOSED = 'closed',
  OPEN = 'open',
  HALF_OPEN = 'half_open',
}

interface CircuitBreakerConfig {
  failureThreshold: number;      // Failures before opening
  successThreshold: number;      // Successes to close from half-open
  timeout: number;               // Time in open state before half-open
}

class CircuitBreaker {
  private state: CircuitState = CircuitState.CLOSED;
  private failures: number = 0;
  private successes: number = 0;
  private lastFailureTime: number = 0;
  private openTime: number = 0;

  constructor(
    private name: string,
    private config: CircuitBreakerConfig,
  ) {}

  async execute<T>(operation: () => Promise<T>, fallback?: () => T): Promise<T> {
    if (this.state === CircuitState.OPEN) {
      if (Date.now() - this.openTime > this.config.timeout) {
        this.state = CircuitState.HALF_OPEN;
        this.successes = 0;
      } else {
        // Circuit is open, fail fast
        if (fallback) return fallback();
        throw new Error(`Circuit ${this.name} is open`);
      }
    }

    try {
      const result = await operation();
      this.onSuccess();
      return result;
    } catch (error) {
      this.onFailure();
      if (fallback) return fallback();
      throw error;
    }
  }

  private onSuccess(): void {
    this.failures = 0;
    if (this.state === CircuitState.HALF_OPEN) {
      this.successes++;
      if (this.successes >= this.config.successThreshold) {
        this.state = CircuitState.CLOSED;
      }
    }
  }

  private onFailure(): void {
    this.failures++;
    this.lastFailureTime = Date.now();

    if (this.failures >= this.config.failureThreshold) {
      this.state = CircuitState.OPEN;
      this.openTime = Date.now();
    }
  }
}
# Istio DestinationRule for Envoy sidecar circuit breaking.
# Pros: Consistent behavior across all services regardless of language,
# no code changes required — works for legacy services.
# Cons: Coarser granularity (per-service, not per-operation),
# limited fallback options (can't return cached data).
apiVersion: networking.istio.io/v1beta1
kind: DestinationRule
metadata:
name: payment-service-circuit-breaker
spec:
host: payment-service.default.svc.cluster.local
trafficPolicy:
connectionPool:
tcp:
maxConnections: 100
http:
h2UpgradePolicy: UPGRADE
http1MaxPendingRequests: 100
http2MaxRequests: 1000
maxRequestsPerConnection: 10
maxRetries: 3
outlierDetection:
# Trip circuit after 5 consecutive 5xx errors
consecutive5xxErrors: 5
# Check every 10 seconds
interval: 10s
# Keep circuit open for 30 seconds (Open state)
baseEjectionTime: 30s
# Max 50% of hosts can be ejected
maxEjectionPercent: 50
# After ejection period, allow probe (Half-Open state)
# Success returns to Closed; failure extends ejection# AWS CloudFormation for API Gateway with Lambda integration.
# Pros: Good for protecting external-facing APIs, managed service.
# Cons: Less sophisticated than app-level breakers, no true
# half-open state, limited to timeout-based protection.
Resources:
PaymentApi:
Type: AWS::ApiGateway::RestApi
Properties:
Name: payment-api
PaymentMethod:
Type: AWS::ApiGateway::Method
Properties:
RestApiId: !Ref PaymentApi
ResourceId: !GetAtt PaymentApi.RootResourceId
HttpMethod: POST
AuthorizationType: NONE
Integration:
Type: AWS_PROXY
IntegrationHttpMethod: POST
Uri: !Sub arn:aws:apigateway:${AWS::Region}:lambda:path/...
# Timeout acts as implicit circuit breaker
TimeoutInMillis: 5000
# Cache responses to reduce backend load
CacheKeyParameters:
- method.request.header.X-Request-Id
CacheNamespace: payments
# Return cached response when backend fails
IntegrationResponses:
- StatusCode: 200
- StatusCode: 503
SelectionPattern: '5\d{2}'
ResponseTemplates:
application/json: '{"error": "service_unavailable"}'The fallback is critical. A circuit breaker that just throws errors is only marginally better than no circuit breaker. Good fallbacks include: returning cached data, returning a degraded response, or returning a static default. The user experience should be “this feature is temporarily unavailable” rather than “the entire site is down.”
Bulkheads for Isolation
The bulkhead pattern comes from ship design. A ship’s hull is divided into watertight compartments. If one compartment floods, the bulkheads contain the damage — the ship stays afloat because the other compartments are isolated.
In software, bulkheads isolate different workloads into separate resource pools. If your analytics queries suddenly go rogue and consume all available database connections, that shouldn’t affect your payment processing. Each workload gets its own pool, and exhausting one pool doesn’t starve the others.
# Spring Boot application.yml with Resilience4j bulkhead configuration.
# Thread pool bulkheads limit concurrent calls per operation type.
resilience4j:
  bulkhead:
    instances:
      criticalApi:
        maxConcurrentCalls: 50
        maxWaitDuration: 100ms
      search:
        maxConcurrentCalls: 20
        maxWaitDuration: 500ms
      analytics:
        maxConcurrentCalls: 10
        maxWaitDuration: 5s

  thread-pool-bulkhead:
    instances:
      criticalApi:
        maxThreadPoolSize: 50
        coreThreadPoolSize: 25
        queueCapacity: 100
      search:
        maxThreadPoolSize: 20
        coreThreadPoolSize: 10
        queueCapacity: 50
      analytics:
        maxThreadPoolSize: 10
        coreThreadPoolSize: 5
        queueCapacity: 20

# HikariCP connection pools - separate pools per workload
spring:
  datasource:
    primary:
      hikari:
        maximum-pool-size: 100
        minimum-idle: 20
        connection-timeout: 1000
    read-replica:
      hikari:
        maximum-pool-size: 50
        minimum-idle: 10
        connection-timeout: 500
// .NET with Polly's BulkheadPolicy for workload isolation.
// Each bulkhead limits concurrent executions independently.
using Polly;
using Polly.Bulkhead;
public class BulkheadConfiguration
{
// Critical API: 50 concurrent, 100 queued
public static AsyncBulkheadPolicy CriticalApiBulkhead { get; } =
Policy.BulkheadAsync(
maxParallelization: 50,
maxQueuingActions: 100,
onBulkheadRejectedAsync: async context =>
{
// Log rejection, increment metrics
await Task.CompletedTask;
});
// Search: 20 concurrent, 50 queued
public static AsyncBulkheadPolicy SearchBulkhead { get; } =
Policy.BulkheadAsync(
maxParallelization: 20,
maxQueuingActions: 50);
// Analytics: 10 concurrent, 20 queued (low priority)
public static AsyncBulkheadPolicy AnalyticsBulkhead { get; } =
Policy.BulkheadAsync(
maxParallelization: 10,
maxQueuingActions: 20);
}
// Usage in a service
public class PaymentService
{
public async Task<PaymentResult> ProcessPayment(PaymentRequest request)
{
return await BulkheadConfiguration.CriticalApiBulkhead
.ExecuteAsync(async () =>
{
// Critical payment processing - isolated from other workloads
return await _paymentGateway.Process(request);
});
}
}; pgBouncer configuration for connection pool bulkheads.
; Separate pools per database/user isolate workloads at the connection level.
[databases]
; Primary database pool - critical workloads
primary = host=db-primary.example.com port=5432 dbname=app \
pool_size=100 min_pool_size=20 reserve_pool_size=10
; Read replica pool - search and read-heavy workloads
replica = host=db-replica.example.com port=5432 dbname=app \
pool_size=50 min_pool_size=10 reserve_pool_size=5
; Analytics database - isolated, lower priority
analytics = host=db-analytics.example.com port=5432 dbname=analytics \
pool_size=20 min_pool_size=5 reserve_pool_size=2
[pgbouncer]
listen_addr = 0.0.0.0
listen_port = 6432
auth_type = md5
auth_file = /etc/pgbouncer/userlist.txt
; Pool mode: transaction gives best connection reuse
pool_mode = transaction
; Global limits
max_client_conn = 1000
default_pool_size = 20
; Timeout settings - reject rather than queue indefinitely
query_timeout = 30
query_wait_timeout = 5
client_idle_timeout = 300The sizing reflects priority. Critical APIs get 50 threads and fast timeouts — they need to respond quickly or not at all. Analytics gets only 10 threads and longer timeouts — it’s acceptable for reports to take 30 seconds, but it’s not acceptable for analytics to consume resources needed elsewhere.
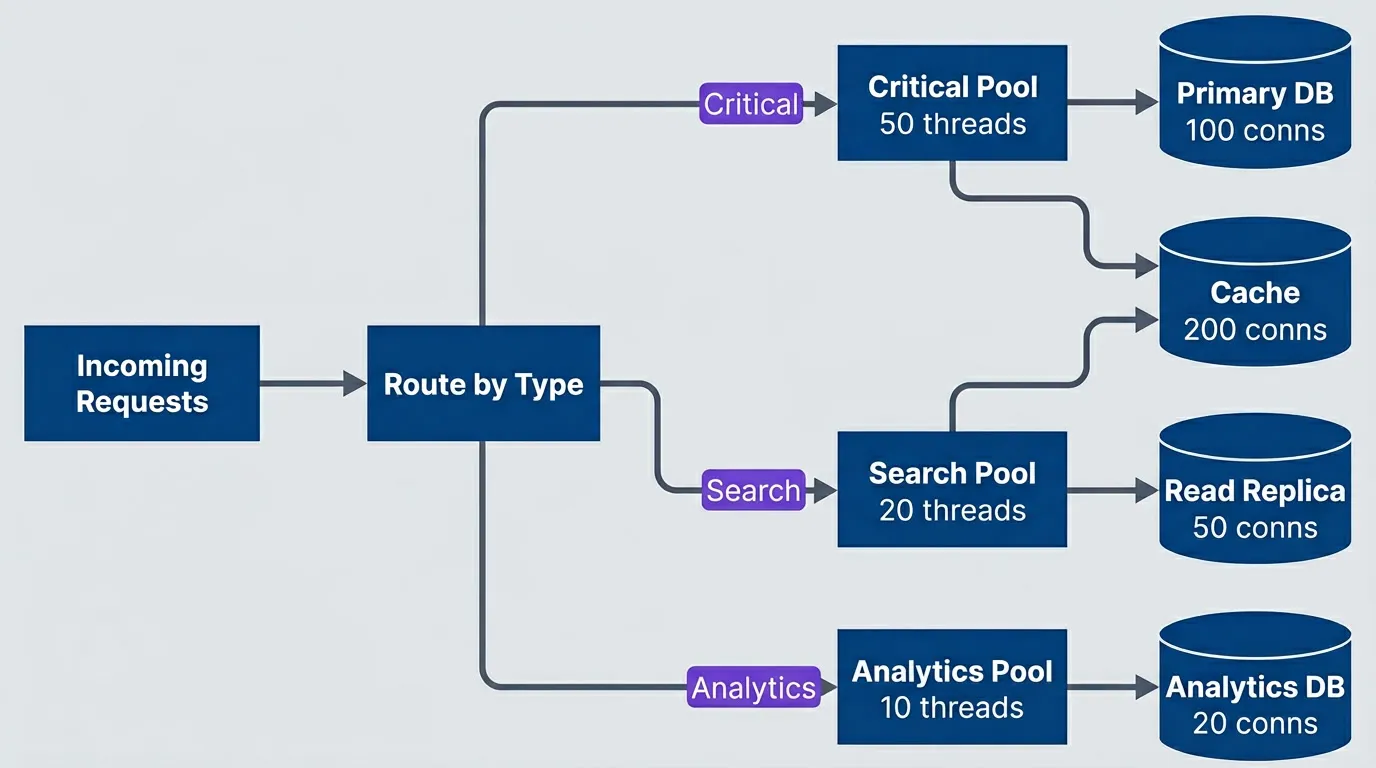
Bulkhead architecture isolating different workloads into separate resource poolsdescription
Flowchart showing workload isolation through separate execution pools. Incoming Requests first reach a decision point labeled Route by Type. Critical traffic is routed to a Critical Pool with 50 threads, Search traffic goes to a Search Pool with 20 threads, and Analytics traffic goes to an Analytics Pool with 10 threads. The Critical Pool uses a Primary DB with 100 connections, the Search Pool uses a Read Replica with 50 connections, and the Analytics Pool uses an Analytics DB with 20 connections. Both Critical and Search traffic also use a shared Cache with 200 connections. The diagram shows how separating thread pools and backing resources limits blast radius so that one workload cannot fully starve another.
Bulkheads ensure that a slow analytics query cannot exhaust the connection pool needed for critical payment processing. Isolation prevents cascading failures across unrelated functionality.
Adaptive Concurrency Limits
Static concurrency limits are a guess. You pick a number, deploy it, and hope it’s right. If your dependencies get faster (new hardware, query optimization), you’re leaving capacity on the table. If they get slower (more data, degraded network), you’re overloading them.
Adaptive concurrency limits adjust automatically based on observed behavior. The algorithm uses AIMD — Additive Increase Multiplicative Decrease — the same approach TCP uses for congestion control. When latency is healthy, slowly increase the limit. When latency exceeds target, cut the limit significantly. This finds the optimal concurrency for current conditions without manual tuning.
// Use in app code
interface AdaptiveLimiterConfig {
  initialLimit: number;
  minLimit: number;
  maxLimit: number;
  targetLatency: number;      // Target P99 latency
  smoothing: number;          // 0-1, how fast to adjust
}

class AdaptiveConcurrencyLimiter {
  private limit: number;
  private inFlight: number = 0;
  private latencies: number[] = [];

  constructor(private config: AdaptiveLimiterConfig) {
    this.limit = config.initialLimit;
  }

  async acquire(): Promise<boolean> {
    if (this.inFlight >= this.limit) {
      return false;
    }
    this.inFlight++;
    return true;
  }

  release(latencyMs: number): void {
    this.inFlight--;
    this.latencies.push(latencyMs);

    // Adjust limit periodically
    if (this.latencies.length >= 100) {
      this.adjustLimit();
      this.latencies = [];
    }
  }

  private adjustLimit(): void {
    const p99 = this.calculateP99();

    if (p99 < this.config.targetLatency * 0.8) {
      // Latency well below target, increase limit (AIMD: additive increase)
      this.limit = Math.min(
        this.config.maxLimit,
        this.limit + 1
      );
    } else if (p99 > this.config.targetLatency) {
      // Latency above target, decrease limit (AIMD: multiplicative decrease)
      this.limit = Math.max(
        this.config.minLimit,
        Math.floor(this.limit * 0.9)
      );
    }
  }

  private calculateP99(): number {
    const sorted = [...this.latencies].sort((a, b) => a - b);
    const index = Math.floor(sorted.length * 0.99);
    return sorted[index];
  }
}If you’d rather not implement this in application code, infrastructure-level options exist. Envoy’s adaptive concurrency filter applies the same AIMD algorithm at the proxy layer — useful in service mesh deployments where you want consistent behavior across polyglot services without code changes. AWS ALB offers some adaptive behavior through its “least outstanding requests” routing algorithm, which naturally sends traffic to less-loaded targets, but it’s coarser-grained: ALB doesn’t implement true AIMD or expose the concurrency limit for tuning, so it won’t protect individual downstream services the way application-level or sidecar-level limiters can.
The asymmetry in AIMD is intentional. Additive increase (+1) means slow, cautious growth when things are good. Multiplicative decrease (×0.9) means rapid reduction when things are bad. This responds quickly to overload while avoiding wild oscillations during normal operation. Netflix’s concurrency-limits library implements this pattern with additional sophistication — worth considering before rolling your own.
Testing Overload Handling
Load Testing for Backpressure
Building backpressure mechanisms isn’t enough — you need to verify they work. Standard load tests measure throughput and latency under expected conditions. Backpressure testing deliberately pushes beyond capacity to validate graceful degradation.
The key insight: you’re not testing whether your system can handle the load. You’re testing whether it fails correctly when it can’t. A successful test might show 50% of requests rejected with 503s — that’s the system protecting itself, not a failure.
Load testing tools like Grafana’s k6 and Locust work well for these scenarios.
I’ve found three scenarios cover most backpressure validation needs:
scenarios:
  - name: "Gradual ramp to saturation"
    description: "Verify graceful degradation as load increases"
    phases:
      - duration: 2m
        rate: 100rps  # Below capacity
      - duration: 2m
        rate: 200rps  # At capacity
      - duration: 2m
        rate: 400rps  # Above capacity
      - duration: 2m
        rate: 100rps  # Recovery
    assertions:
      - "p99_latency < 1s during all phases"
      - "error_rate < 5% when rate <= capacity"
      - "503_rate increases gracefully above capacity"
      - "recovery to normal within 30s of load reduction"

  - name: "Sudden spike"
    description: "Verify system survives traffic spike"
    phases:
      - duration: 1m
        rate: 100rps  # Baseline
      - duration: 30s
        rate: 1000rps  # 10x spike
      - duration: 2m
        rate: 100rps  # Return to baseline
    assertions:
      - "no complete outage during spike"
      - "goodput remains > 50% of baseline during spike"
      - "full recovery within 60s after spike"

  - name: "Sustained overload"
    description: "Verify stable degradation under prolonged overload"
    phases:
      - duration: 10m
        rate: 300rps  # 50% above capacity
    assertions:
      - "system remains responsive throughout"
      - "no resource exhaustion (memory, connections)"
- "error rate stabilizes (not increasing)"The “gradual ramp” scenario is the foundation. Watch for these signals as you cross capacity: queue depths should grow but plateau (shedding kicks in), 503 rates should increase proportionally (admission control working), and latency for successful requests should stay bounded (CoDel or similar doing its job). The recovery phase is equally important — a system that can’t return to normal after overload subsides has a leak somewhere.
The “sudden spike” scenario simulates flash crowds — Black Friday launches, viral posts, or just someone’s misconfigured retry loop. The goal isn’t zero errors during the spike; it’s survival. If goodput drops to zero during a 10x spike, your system is too brittle. If it maintains 50% of baseline throughput while rejecting the excess, that’s success.
“Sustained overload” catches a different class of bugs: resource leaks under pressure. A system might handle a 2-minute spike just fine but accumulate dead connections, grow heap indefinitely, or exhaust file descriptors over 10 minutes of steady overload. The key assertion is stabilization—error rates should plateau, not keep climbing.
The key is the assertions — don’t just measure throughput, explicitly verify that backpressure mechanisms activated at the right thresholds.
Chaos Engineering for Overload
Load testing validates behavior under high request volume. Chaos engineering validates behavior under unexpected failures—the scenarios that trigger backpressure mechanisms in ways traffic alone can’t simulate.
| Experiment | Method | Expected Behavior |
|---|---|---|
| Queue bomb | Fill queues to capacity | System sheds load, stays responsive |
| Thread starvation | Block worker threads | Circuit breakers trip, fallbacks activate |
| Memory pressure | Allocate memory in dependency | GC pressure handled, graceful degradation |
| Connection exhaustion | Hold connections open | New requests rejected cleanly |
| Cascade trigger | Fail upstream service | Downstream services shed load appropriately |
Connection exhaustion is my go-to first chaos experiment because it’s both common in production and easy to simulate. Database connection pools are the usual culprit — a slow query holds a connection, the pool fills, and suddenly every request is waiting for a connection that won’t come.
#!/bin/bash
# Chaos experiment: Verify system survives connection exhaustion

echo "Starting connection exhaustion experiment"

# Hold 90% of database connections
for i in {1..90}; do
  psql -h db.example.com -c "SELECT pg_sleep(300)" &
done

echo "Holding 90 connections for 5 minutes"
echo "Monitoring system behavior..."

# Monitor during experiment
for i in {1..60}; do
  curl -s http://app.example.com/health | jq '.status'
  curl -s http://app.example.com/metrics | grep 'http_requests_total'
  sleep 5
done

# Cleanup
echo "Releasing connections"
pkill -f "pg_sleep"

echo "Experiment complete. Check dashboards for behavior analysis."
#!/usr/bin/env python3
"""Chaos experiment: Verify system survives connection exhaustion."""
import asyncio
import signal
import sys
import asyncpg
import httpx
async def hold_connection(pool: asyncpg.Pool, duration: int) -> None:
"""Acquire a connection and hold it with a long-running query."""
async with pool.acquire() as conn:
await conn.execute(f"SELECT pg_sleep({duration})")
async def monitor_health(app_url: str, interval: int, iterations: int) -> None:
"""Poll health and metrics endpoints during the experiment."""
async with httpx.AsyncClient() as client:
for _ in range(iterations):
try:
health = await client.get(f"{app_url}/health")
print(f"Health: {health.json().get('status', 'unknown')}")
metrics = await client.get(f"{app_url}/metrics")
for line in metrics.text.splitlines():
if "http_requests_total" in line:
print(line)
except httpx.RequestError as e:
print(f"Request failed: {e}")
await asyncio.sleep(interval)
async def run_experiment() -> None:
db_url = "postgresql://user:pass@db.example.com/app"
app_url = "http://app.example.com"
num_connections = 90
hold_duration = 300 # 5 minutes
print("Starting connection exhaustion experiment")
# Create pool and hold 90% of connections
pool = await asyncpg.create_pool(db_url, min_size=num_connections, max_size=num_connections)
print(f"Holding {num_connections} connections for {hold_duration // 60} minutes")
print("Monitoring system behavior...")
# Start connection holders and monitoring concurrently
holders = [hold_connection(pool, hold_duration) for _ in range(num_connections)]
monitor = monitor_health(app_url, interval=5, iterations=60)
await asyncio.gather(monitor, *holders, return_exceptions=True)
# Cleanup
print("Releasing connections")
await pool.close()
print("Experiment complete. Check dashboards for behavior analysis.")
if __name__ == "__main__":
# Handle Ctrl+C gracefully
signal.signal(signal.SIGINT, lambda *_: sys.exit(0))
asyncio.run(run_experiment())What should happen when you run this? If your bulkheads are working, the connection-starved workload should degrade while others continue normally. If your circuit breakers are working, requests that can’t get connections should fail fast rather than timeout. If neither is working, you’ll see cascading failure — the connection wait blocks threads, which blocks request processing, which backs up the request queue, which exhausts memory. That’s exactly what you’re testing for.
For thread starvation, inject artificial latency into a dependency (a chaos proxy like Toxiproxy works well). Watch for circuit breakers tripping and fallbacks activating. For memory pressure, use stress-ng or similar to consume memory on the host running a dependency. Watch for graceful degradation rather than OOM kills propagating to callers.
Never run chaos experiments in production without proper safeguards. Start in staging, have kill switches ready, and ensure the blast radius is contained.
Testing tells you whether your backpressure mechanisms work. But in production, you need to see them working — or not working — in real time. That’s where observability comes in.
Observability for Overload
Key Metrics to Monitor
You can’t manage what you can’t measure — and during overload, you need to measure the right things. Standard throughput and latency metrics tell you how the system is performing, but backpressure observability requires metrics that tell you why and where the system is protecting itself.
I organize overload metrics into three categories: capacity indicators (how close are we to limits?), backpressure indicators (are protection mechanisms activating?), and health indicators (are we still serving users effectively?).
# Pseudocode
metrics:
  # Capacity indicators
  - name: request_rate
    type: counter
    labels: [endpoint, status]
    alert: "rate > capacity_threshold"

  - name: concurrent_requests
    type: gauge
    labels: [service]
    alert: "value > concurrency_limit * 0.9"

  - name: queue_depth
    type: gauge
    labels: [queue_name]
    alert: "value > max_depth * 0.8"

  # Backpressure indicators
  - name: requests_rejected
    type: counter
    labels: [reason]  # rate_limit, queue_full, circuit_open

  - name: shed_requests
    type: counter
    labels: [tier, reason]

  - name: retry_after_seconds
    type: histogram
    labels: [endpoint]

  # Health indicators
  - name: goodput_ratio
    type: gauge
    description: "successful_requests / total_requests"
    alert: "value < 0.9"

  - name: latency_p99
    type: histogram
    labels: [endpoint]
    alert: "value > slo_threshold"
from prometheus_client import Counter, Gauge, Histogram, start_http_server
# Capacity indicators
REQUEST_RATE = Counter(
'http_requests_total',
'Total HTTP requests',
['endpoint', 'status']
)
CONCURRENT_REQUESTS = Gauge(
'http_concurrent_requests',
'Currently in-flight requests',
['service']
)
QUEUE_DEPTH = Gauge(
'queue_depth',
'Current queue depth',
['queue_name']
)
# Backpressure indicators
REQUESTS_REJECTED = Counter(
'requests_rejected_total',
'Requests rejected by backpressure mechanisms',
['reason'] # rate_limit, queue_full, circuit_open, admission_control
)
SHED_REQUESTS = Counter(
'requests_shed_total',
'Requests shed during degradation',
['tier', 'reason']
)
RETRY_AFTER = Histogram(
'retry_after_seconds',
'Retry-After values returned to clients',
['endpoint'],
buckets=[1, 5, 10, 30, 60, 120, 300]
)
# Health indicators
GOODPUT_RATIO = Gauge(
'goodput_ratio',
'Ratio of successful requests to total requests'
)
LATENCY = Histogram(
'http_request_duration_seconds',
'Request latency',
['endpoint'],
buckets=[.005, .01, .025, .05, .1, .25, .5, 1, 2.5, 5, 10]
)
# Usage in middleware
def track_request(endpoint: str, status: int, duration: float, rejected_reason: str | None = None):
REQUEST_RATE.labels(endpoint=endpoint, status=str(status)).inc()
LATENCY.labels(endpoint=endpoint).observe(duration)
if rejected_reason:
REQUESTS_REJECTED.labels(reason=rejected_reason).inc()from datadog import initialize, statsd
# Initialize Datadog client
initialize(statsd_host='localhost', statsd_port=8125)
class OverloadMetrics:
"""Datadog metrics for overload monitoring."""
@staticmethod
def track_request(endpoint: str, status: int, duration: float):
"""Track a completed request."""
tags = [f'endpoint:{endpoint}', f'status:{status}']
# Capacity indicator
statsd.increment('http.requests.total', tags=tags)
# Health indicator
statsd.histogram('http.request.duration', duration, tags=tags)
@staticmethod
def set_concurrent_requests(service: str, count: int):
"""Update concurrent request gauge."""
statsd.gauge('http.concurrent_requests', count, tags=[f'service:{service}'])
@staticmethod
def set_queue_depth(queue_name: str, depth: int):
"""Update queue depth gauge."""
statsd.gauge('queue.depth', depth, tags=[f'queue:{queue_name}'])
@staticmethod
def track_rejection(reason: str):
"""Track a rejected request."""
statsd.increment('requests.rejected', tags=[f'reason:{reason}'])
@staticmethod
def track_shed(tier: str, reason: str):
"""Track a shed request during degradation."""
statsd.increment('requests.shed', tags=[f'tier:{tier}', f'reason:{reason}'])
@staticmethod
def set_goodput_ratio(ratio: float):
"""Update goodput ratio gauge."""
statsd.gauge('goodput.ratio', ratio)
@staticmethod
def track_retry_after(endpoint: str, seconds: int):
"""Track Retry-After header value."""
statsd.histogram('retry_after.seconds', seconds, tags=[f'endpoint:{endpoint}'])
# Usage
metrics = OverloadMetrics()
metrics.track_request('/api/orders', 200, 0.045)
metrics.track_rejection('rate_limit')
metrics.set_goodput_ratio(0.92)import { metrics } from '@opentelemetry/api';
const meter = metrics.getMeter('overload-metrics');
// Capacity indicators
const requestCounter = meter.createCounter('http.requests.total', {
description: 'Total HTTP requests',
});
const concurrentRequests = meter.createUpDownCounter('http.concurrent_requests', {
description: 'Currently in-flight requests',
});
const queueDepth = meter.createObservableGauge('queue.depth', {
description: 'Current queue depth',
});
// Backpressure indicators
const requestsRejected = meter.createCounter('requests.rejected.total', {
description: 'Requests rejected by backpressure mechanisms',
});
const requestsShed = meter.createCounter('requests.shed.total', {
description: 'Requests shed during degradation',
});
const retryAfterHistogram = meter.createHistogram('retry_after.seconds', {
description: 'Retry-After values returned to clients',
boundaries: [1, 5, 10, 30, 60, 120, 300],
});
// Health indicators
const goodputRatio = meter.createObservableGauge('goodput.ratio', {
description: 'Ratio of successful requests to total requests',
});
const latencyHistogram = meter.createHistogram('http.request.duration', {
description: 'Request latency in seconds',
unit: 's',
boundaries: [0.005, 0.01, 0.025, 0.05, 0.1, 0.25, 0.5, 1, 2.5, 5, 10],
});
// Usage in middleware
function trackRequest(
endpoint: string,
status: number,
durationMs: number,
rejectedReason?: string
) {
requestCounter.add(1, { endpoint, status: String(status) });
latencyHistogram.record(durationMs / 1000, { endpoint });
if (rejectedReason) {
requestsRejected.add(1, { reason: rejectedReason });
}
}
function trackRejection(reason: 'rate_limit' | 'queue_full' | 'circuit_open' | 'admission_control') {
requestsRejected.add(1, { reason });
}
function trackShed(tier: string, reason: string) {
requestsShed.add(1, { tier, reason });
}Those metrics matter because they tell you three different things: how close you are to overload, whether your protection mechanisms are firing, and whether users are still getting successful responses.
- Capacity indicators:Your early warning system. When concurrent_requests crosses 90% of your concurrency limit, you're not in trouble yet — but you're one traffic spike away. When queue_depth grows faster than it drains, backpressure is about to kick in. These metrics let you see overload coming before users notice.
- Backpressure indicators:Tells you when protection mechanisms are active. A spike in requests_rejected with reason rate_limit means your rate limiter is doing its job. If you see rejections with reason circuit_open, a downstream dependency is struggling. The `shed_requests` counter broken down by tier shows which degradation level you're operating at. These metrics answer the question: "Is the system protecting itself correctly?"
- Health indicators:The bottom line. goodput_ratio is the most important — it's the percentage of requests that actually succeeded. A 503 is a successful rejection (the system protected itself), but it's not goodput. If goodput drops below your SLO, users are suffering regardless of how well your backpressure mechanisms work. Latency percentiles matter too: p99 staying bounded while p50 degrades slightly is healthy backpressure; p99 exploding means something's queuing that shouldn't be.
Of those three categories, the rejection metrics are usually the fastest way to identify which protective layer is currently absorbing the pressure.
The requests_rejected label reason is critical. During an incident, you need to know which mechanism is rejecting — rate limiter, circuit breaker, queue full, or admission control. Different reasons point to different root causes.
Dashboard Layout
A good overload dashboard tells a story at a glance. When you’re paged at 3 AM, you shouldn’t have to hunt through 15 panels to understand what’s happening. I’ve found a four-section layout works well:
| # | Section | Panels | Purpose |
|---|---|---|---|
| 1 | Load & Capacity | Request Rate, Concurrency, Queue Depth | Current vs. max capacity indicators |
| 2 | Backpressure Activity | 429s/min, 503s/min, Shed Rate, Circuit State | Active backpressure mechanisms |
| 3 | Health Indicators | Goodput %, P99 Latency, Error Rate | Are we serving users effectively? |
| 4 | Degradation State | Current Tier, Features Disabled | Operational mode at a glance |
That layout works because each section answers a different on-call question, and the order mirrors how you triage an overload event in real time.
- 1Load & Capacity:Goes at the top because it's your first question: "How much traffic are we getting, and how close are we to limits?" Show request rate as a line with capacity threshold as a horizontal marker. Show concurrency and queue depth as gauges with red zones. At a glance, you should see whether you're at 50% capacity or 95%.
- 2Backpressure Activity:Answers the second question: "Is the system protecting itself?" Show rejection rates by type—429s (rate limiting), 503s (admission control), circuit breaker state (open/closed/half-open). If these counters are at zero, you're not in overload. If they're spiking, the system is actively shedding load. This section turns from green to yellow to red as backpressure intensifies.
- 3Health Indicators:Answers the critical question: "Are users being served?" Goodput percentage should be front and center — if it's above 95%, things are okay even if you're shedding some load. P99 latency shows whether successful requests are still fast. Error rate distinguishes between deliberate rejections (503s you sent) and unexpected failures (5xxs from bugs).
- 4Degradation State:Shows operational mode at a glance. If you've implemented graceful degradation tiers, show the current tier prominently — a big "ELEVATED" or "CRITICAL" badge tells the on-call engineer immediately that the system is in a degraded state. List which features are disabled so they don't waste time investigating why search isn't working.
When those sections are arranged well, the dashboard stops being a wall of charts and starts reading like a short incident narrative.
During an incident, read the dashboard top to bottom: “We’re at 120% capacity (Load), rejecting 20% of requests (Backpressure), maintaining 85% goodput (Health), in ELEVATED mode with recommendations disabled (Degradation).” That’s a complete situational picture in 10 seconds.
Conclusion
Every system has limits. The question isn’t whether yours will face overload — it’s whether it will handle overload gracefully or collapse catastrophically. The patterns in this article share a common philosophy: admit your limits, communicate them clearly, and degrade predictably.
Here’s what that looks like in practice:
- Fast rejection beats slow failure:—When you can't serve a request, say so immediately. A 503 returned in 5ms is infinitely better than a timeout after 30 seconds. The fast rejection frees resources, gives the client useful information, and preserves capacity for requests you _can_ serve. Every slow failure is a cascading failure waiting to happen.
- Backpressure requires cooperation:—Your server-side mechanisms — rate limiting, admission control, circuit breakers — only work if clients understand and respect the signals. Return proper status codes (429, 503). Include `Retry-After` headers. Document your backpressure behavior. And if you control the clients, implement exponential backoff with jitter. A system where servers shed load but clients immediately retry is a system that's fighting itself.
- Isolation contains failures:—Bulkheads ensure that a runaway analytics query can't starve your payment processing. Circuit breakers ensure that a failing dependency can't take down callers. Separate resource pools, separate failure domains. When something breaks — and something always breaks — the blast radius should be contained.
- Graceful degradation preserves what matters:—Not all features are equally important. During overload, shed the non-essential (personalization, recommendations, fancy animations) to preserve the critical (authentication, checkout, core functionality). Work with product owners to classify features _before_ the incident. The middle of an outage is the wrong time to debate priorities.
- Observability makes it all work:—You can't manage what you can't measure. Track capacity indicators to see overload coming. Track backpressure indicators to verify protection mechanisms are activating. Track health indicators to know if users are actually being served. Build dashboards that tell the story at a glance.
The underlying principle is simple: some work completing successfully is better than all work failing. A system that accepts 2,000 requests per second when it can only handle 1,000 will serve nobody well. A system that accepts 1,000 and rejects 1,000 with clear signals serves half its users perfectly and gives the other half actionable information.
Backpressure isn’t about handling unlimited load — nothing can do that. It’s about maintaining service quality within your design capacity and degrading predictably beyond it. Build systems that know their limits, and you’ll build systems that survive.
Sharethisarticle
Enjoyed the read? Share it with your network.




