
Structured Logging: Standards That Stick at Scale


Table of Contents
At 3 AM, I’m grepping through logs from twelve services trying to trace a single user request. One service logs user_id=12345, another logs {"user":"12345"}, a third logs User 12345 logged in. Same user, three different patterns. I write five regex queries, hit enter, and watch results scroll by — but something’s wrong. The inventory service is silent. After twenty minutes, I discover it uses customer_id instead of user_id. My queries missed it entirely.
That’s when I understood: logging JSON isn’t the same as having a log schema.
Why Structured Logging Matters
The transition from printf-style logging to JSON is just the first step. Without a shared schema, you’ve replaced one problem (unstructured text) with another (incompatible structures). What matters isn’t the format — it’s the contract.
The Inconsistency Tax
Consider what happens when five services each log authentication events their own way:
- Service A:User 12345 logged in from 192.168.1.1
- Service B:[INFO] Login successful - user_id=12345, ip=192.168.1.1
- Service C:{"user":"12345","action":"login","source_ip":"192.168.1.1"}
- Service D:2024-01-15 14:30:00 INFO user 12345 authenticated
- Service E:{"userId":"12345","event":"AUTH_SUCCESS"}
Finding all logins for user 12345 now requires five different search patterns. Worse, you don’t know what you’re missing. Did you account for the service that uses customer instead of user? The one that logs to a different index? The one with the typo in the field name?
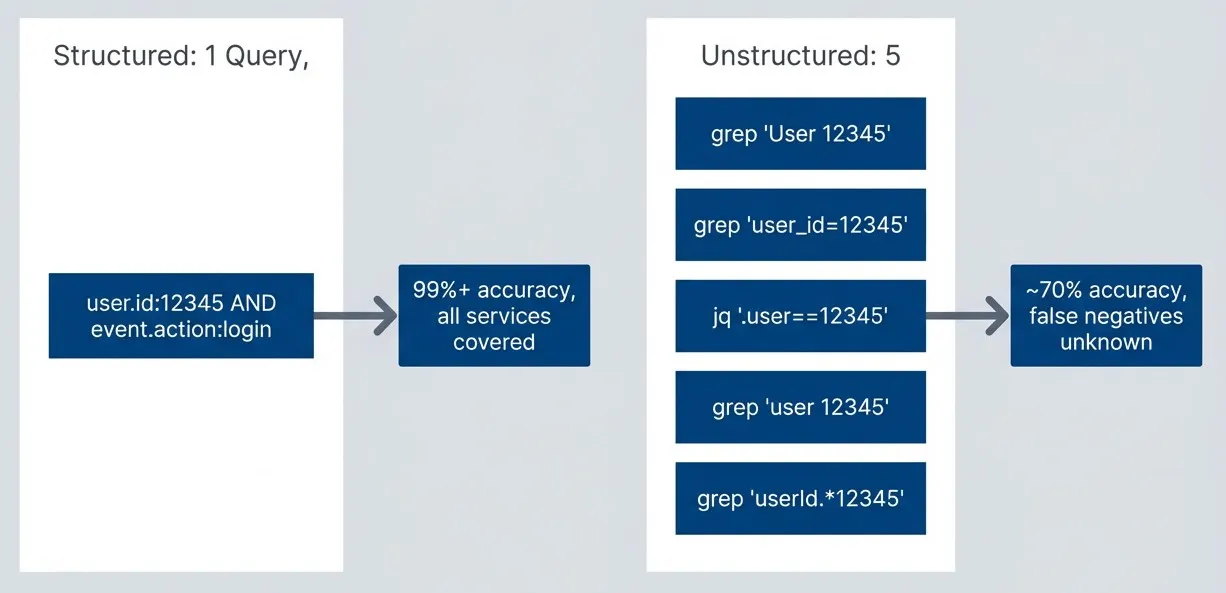
Schema query coverage comparison.description
A top-to-bottom flowchart comparing unstructured logging with structured logging. The first subgraph is labeled "Unstructured: 5 Queries, Uncertain Coverage" and contains five separate search patterns: grep for "User 12345", grep for "user_id=12345", a jq filter on the user field, grep for "user 12345", and grep for "userId.*12345". These multiple searches represent fragmented field naming across services. An arrow from this subgraph points to a result box stating approximately 70 percent accuracy with unknown false negatives. The second subgraph is labeled "Structured: 1 Query, Full Coverage" and contains a single query, "user.id:12345 AND event.action:login". An arrow from that subgraph points to a result box stating 99 percent or higher accuracy with all services covered. The diagram communicates that schema consistency reduces many incomplete searches into one reliable query.
Quantifying the Cost
The difference between ad-hoc logging and schema-based logging shows up in every metric that matters during incidents.
| Metric | Ad-hoc Logging | Schema-based Logging | Impact |
|---|---|---|---|
| Time to find relevant logs | 15 min | 2 min | 87% reduction |
| Query accuracy | ~70% | 99%+ | 30% fewer false negatives |
| Storage cost | Baseline | 0.7x baseline | 30% reduction |
| Dashboard creation time | Hours | Minutes | 90%+ reduction |
| Cross-service correlation | Manual | Automatic | Hours saved per incident |
| Compliance audit time | Days | Hours | 80% reduction |
The storage savings come from better compression — consistent field names compress dramatically better than arbitrary strings. The query accuracy improvement comes from knowing exactly which field to search. The time savings compound: every query, every dashboard, every alert benefits from the consistency.
JSON is a format, not a schema. Two services can emit valid JSON logs with completely incompatible field names. Structured logging requires both: a machine-readable format and a shared vocabulary.
So how do you design a schema that actually sticks?
Designing Your Log Schema
Every schema decision you make in month one will constrain your queries for years. Get the fundamentals right before any service ships a log.
Schema Design Principles
Six rules that prevent the most common schema regrets:
| # | Principle | Rationale | Good | Bad |
|---|---|---|---|---|
| 1 | Namespaced field names | Prevents collisions, enables discovery | http.request.method, user.id | method, id (ambiguous) |
| 2 | Consistent data types | Enables indexing and aggregation | user.id: always string | user.id: sometimes string, sometimes int |
| 3 | ISO 8601 timestamps | Timezone-aware, sortable, universal | 2024-01-15T14:30:00.123Z | 01/15/2024 2:30 PM, epoch ms |
| 4 | Flat over nested | Most log platforms query flat fields better | http.request.headers.content_type | http: { request: { headers: {...}}} |
| 5 | Enums for categories | Enables faceted search, prevents typos | log.level: error, warn, info | level: ERROR, Error, err |
| 6 | Units in field names | Prevents calculation errors | http.response.time_ms | response_time (seconds? ms?) |
The flat-over-nested rule surprises people. Dot notation like http.request.method looks nested but stores flat in Elasticsearch. Actual nested JSON objects require special nested field mappings, slow down queries, and complicate aggregations. Use dots in field names, not actual object nesting.
Adopting Elastic Common Schema (ECS)
Don’t invent a schema. Elastic Common Schema (ECS) is the standard worth adopting.
ECS provides namespaced fields for every common logging scenario: HTTP requests (http.*), errors (error.*), users (user.*), services (service.*), traces (trace.*), and events (event.*). The field names are already documented. The data types are already specified. Dashboards and detection rules exist that expect ECS fields.
Here’s a Pino1 configuration that emits ECS-compliant logs:
import pino from 'pino'

const logger = pino({
  formatters: {
    level(label) {
      return { 'log.level': label }
    },
  },
  messageKey: 'message',
  timestamp: () => `,"@timestamp":"${new Date().toISOString()}"`,
  base: {
    'service.name': process.env.SERVICE_NAME,
    'service.version': process.env.SERVICE_VERSION,
    'service.environment': process.env.NODE_ENV,
    'service.node.name': process.env.HOSTNAME || process.env.POD_NAME,
  },
})

export { logger }Usage produces logs that any ECS-aware tool can parse:
logger.info({
  'http.request.method': 'POST',
  'http.request.path': '/api/orders',
  'http.response.status_code': 201,
  'user.id': 'usr_12345',
  'event.category': ['web'],
  'event.action': 'order_created',
  'event.outcome': 'success',
}, 'Order created successfully')The key ECS namespaces you’ll use most often:
| Namespace | Purpose | Common Fields |
|---|---|---|
| service.* | Service identification | service.name, service.version, service.environment |
| http.* | HTTP request/response | http.request.method, http.response.status_code |
| error.* | Error details | error.type, error.message, error.stack_trace |
| user.* | User context | user.id, user.name, user.roles |
| trace.* | Distributed tracing | trace.id, span.id |
| event.* | Event categorization | event.action, event.outcome, event.category |
Custom Fields and Extensions
ECS won’t cover everything. Order IDs, customer tiers, feature flags — your domain has fields that no standard anticipates. The question isn’t whether to add custom fields, but how to add them without creating the inconsistency problems you’re trying to solve.
When you need custom fields, follow ECS conventions: use a dedicated namespace, document it in your schema registry, and keep it minimal. Every custom field you add is a field your teammates need to learn.
// Extend the base logger with order-specific fields
const orderLogger = logger.child({
  'order.id': order.id,
  'order.status': order.status,            // 'pending' | 'confirmed' | 'shipped'
  'order.total_cents': order.totalCents,   // Units in field name
  'order.item_count': order.items.length,
  'customer.tier': customer.tier,          // 'free' | 'premium' | 'enterprise'
})

orderLogger.info({ 'event.action': 'order_confirmed' }, 'Order confirmed')
Custom namespace order.* for domain-specific fields. Note that amounts use cents (avoiding float precision issues) and the field name includes the unit.
Custom namespaces should be rare. Before adding order.shipping_method, check if ECS already has a field that fits. Custom fields increase cognitive load and reduce interoperability with pre-built dashboards and detection rules.
Correlation ID Implementation
A schema gets you consistent field names. But when a request fails, you need more than consistency — you need to see every log from every service that touched that request. That’s where correlation IDs come in.
A single user action — placing an order, uploading a file, logging in — touches multiple services: API gateways, business logic services, payment processors, notification systems, databases. Without correlation IDs, each service’s logs are islands. You know something failed, but stitching together the sequence of events across service boundaries requires manual timestamp correlation and guesswork.
Correlation IDs solve this by threading a common identifier through every log entry related to a single logical operation. Query by that ID, and you get the complete story — regardless of how many services participated.
Correlation ID Types
Not all correlation happens at the same scope. A single user session might span hundreds of requests, each request might fan out to dozens of service calls, and async operations might continue long after the original request completes. Different ID types address different correlation needs:
| # | ID Type | Scope | Generated By | Lifespan | Use Case |
|---|---|---|---|---|---|
| 1 | trace.id | Distributed trace | Edge/first service | Single request tree | Debugging request flow |
| 2 | span.id | Single operation | Each service | One operation | Identifying service involvement |
| 3 | request.id | HTTP request | API gateway | Single HTTP request | Correlating gateway with downstream |
| 4 | session.id | User session | Auth system | Session duration | Tracking user activity across requests |
| 5 | transaction.id | Business operation | Domain service | Until completion | Tracking sagas and workflows |
| 6 | causation.id | Event chain | Message producer | One hop | Understanding event triggers |
The interface below shows the full correlation context. In practice, you won’t use every field in every log — include what you’ll actually query:
// Correlation ID hierarchy
interface CorrelationContext {
  // Request-level: entire user request across all services
  requestId: string       // Generated at edge/API gateway

  // Trace-level: distributed trace context (OpenTelemetry)
  traceId: string         // Propagated via W3C Trace Context
  spanId: string          // Current operation within trace
  parentSpanId?: string   // Parent operation

  // Session-level: user session across multiple requests
  sessionId?: string      // From session cookie or JWT

  // Business transaction: logical operation across requests
  transactionId?: string  // e.g., order fulfillment saga

  // Causation: what triggered this operation
  causationId?: string    // ID of the event/message that caused this
}When all correlation IDs are present, a single log entry becomes a portal to multiple views of the same operation:
// Example log showing all correlation levels
const logEntry = {
  '@timestamp': '2024-01-15T14:30:00.123Z',
  'message': 'Payment authorized',

  // All correlation IDs present
  'trace.id': '4bf92f3577b34da6a3ce929d0e0e4736',
  'span.id': '00f067aa0ba902b7',
  'transaction.id': 'order-12345',           // Business transaction
  'request.id': 'req_abc123',                // Edge-assigned request ID
  'session.id': 'sess_xyz789',               // User session
  'event.causation_id': 'order_created_evt', // What triggered this
}

// This single log entry enables:
// - trace.id query: all logs for this request across services
// - transaction.id query: entire order fulfillment saga
// - session.id query: everything this user did in their session
// - causation_id query: what event triggered this paymentHow Correlation Flows Through Services
When a user places an order, the request flows through multiple services. Each service creates its own span but preserves the trace ID, allowing the entire flow to be reconstructed. Watch for two things in this diagram: trace IDs stay constant (that’s how you query across services), while span IDs change at each hop (that’s how you identify which service you’re looking at):
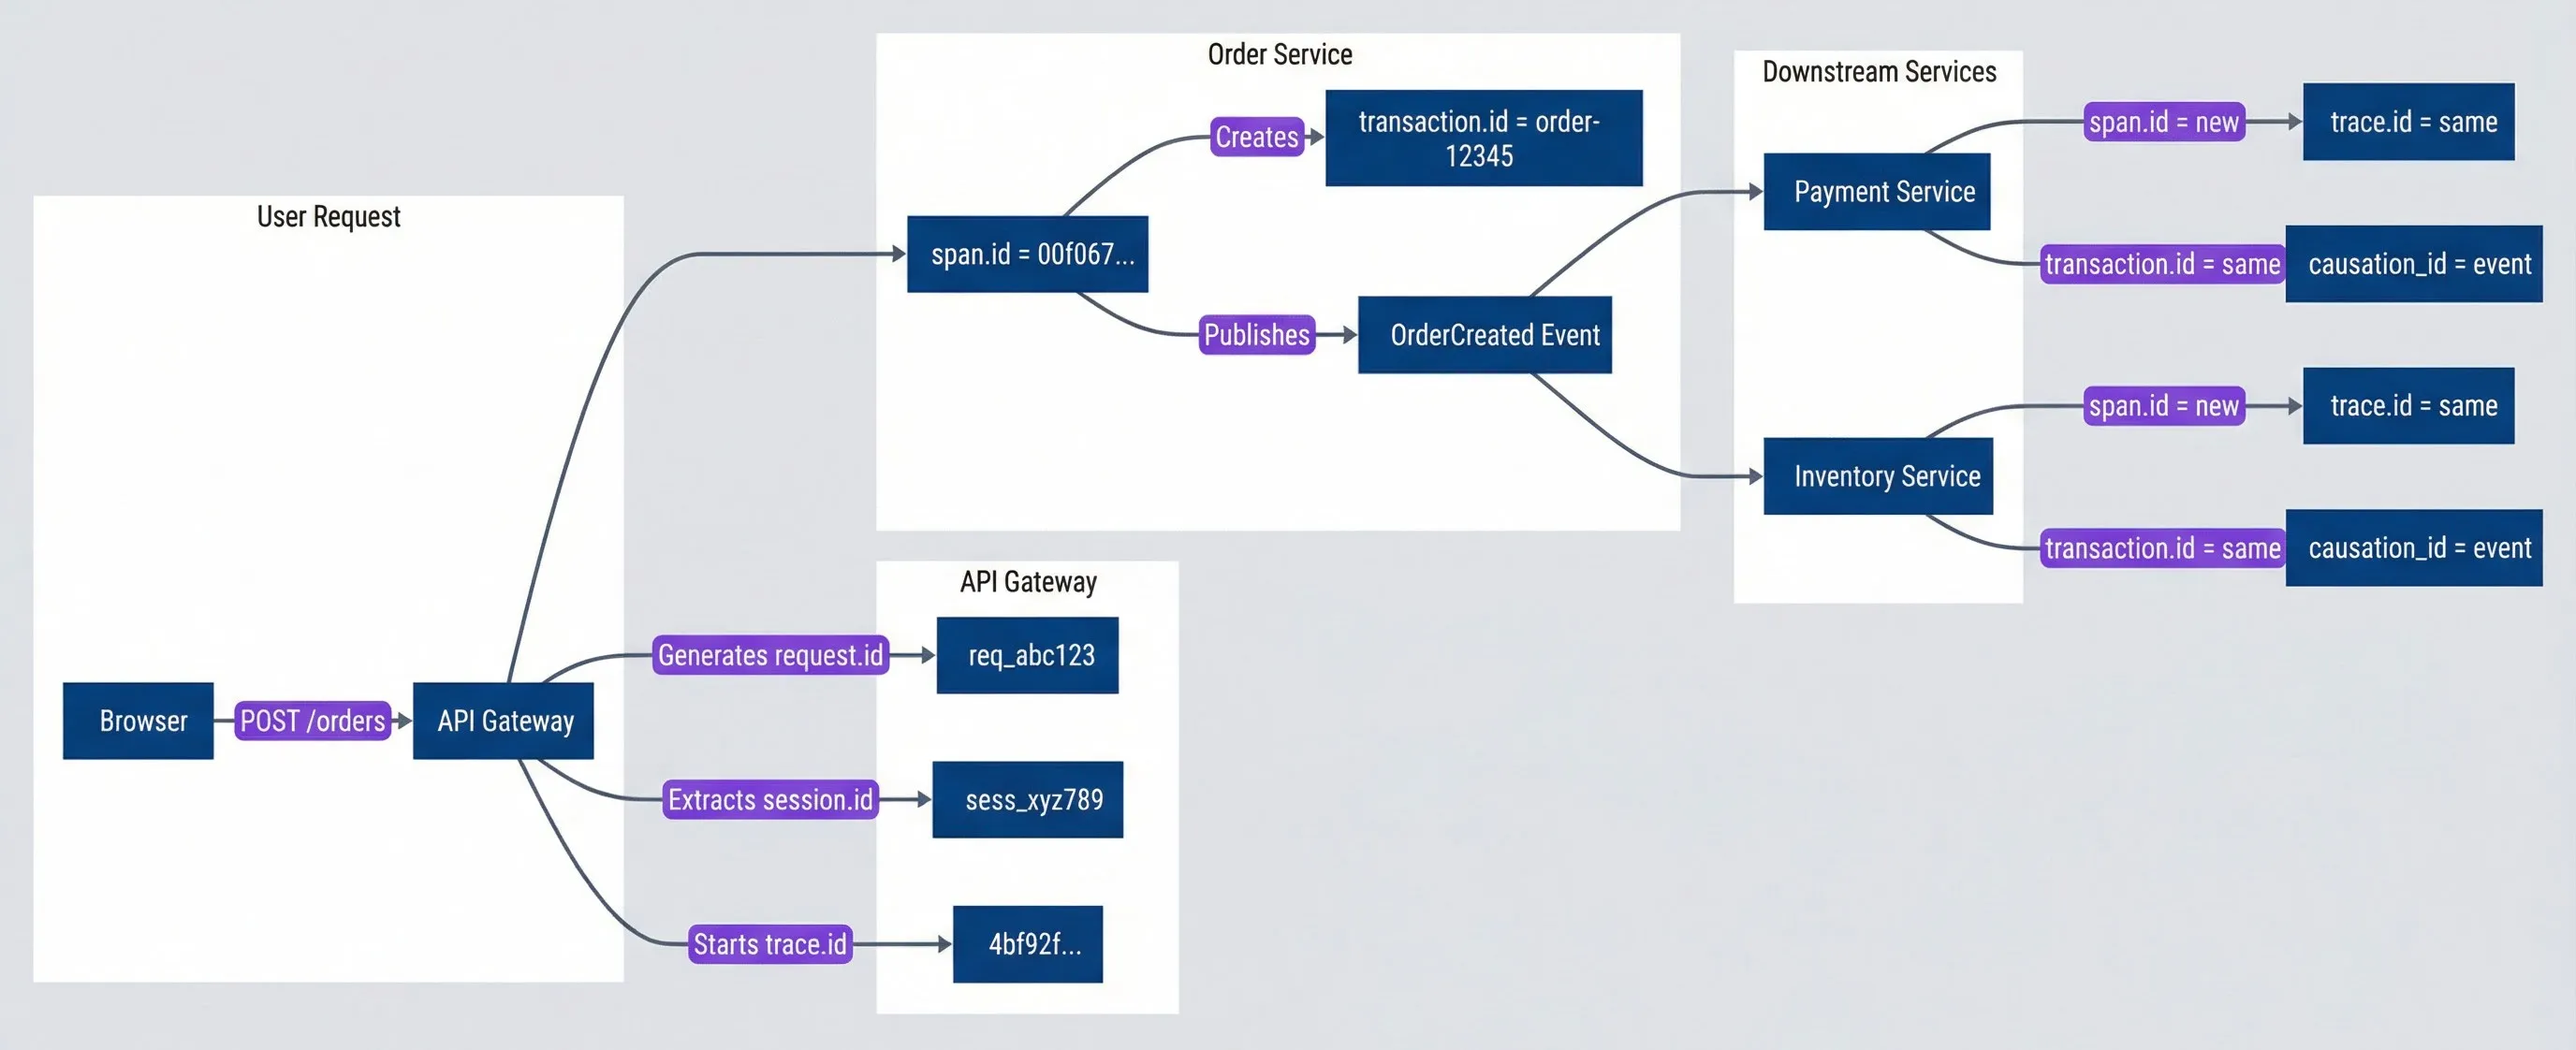
Correlation ID flow across services.description
A top-to-bottom flowchart showing how correlation identifiers move through an order placement request. The first subgraph, "User Request," shows a browser sending POST /orders to an API Gateway. The next subgraph, "API Gateway," shows the gateway generating request.id req_abc123, extracting session.id sess_xyz789, and starting trace.id 4bf92f... . The gateway then forwards the request to the "Order Service" subgraph, where span.id 00f067... creates transaction.id order-12345 and publishes an OrderCreated Event. That event fans out to two downstream services: Payment Service and Inventory Service. Each downstream service creates a new span.id while keeping the same trace.id and the same transaction.id, and each records a causation_id pointing back to the event. The diagram emphasizes that trace.id is the stable identifier across the full request tree, span.id changes at each hop, and transaction.id follows the business workflow across services.
The key insight: trace.id stays constant across all services for a single request tree. Query trace.id:4bf92f* and you see every log from every service involved in that order placement — API gateway, order service, payment service, inventory service, notification service.
The W3C Trace Context standard defines how to propagate trace and span IDs in HTTP headers via the traceparent header. Use it — it’s supported by OpenTelemetry, Jaeger, Zipkin, and most APM tools. Don’t invent your own trace header format.
Propagation Mechanisms
Correlation IDs are useless if they don’t propagate. Every service-to-service call — HTTP, gRPC, message queue — must carry the correlation context forward.
HTTP Header Propagation
For synchronous HTTP calls, correlation IDs travel in headers. The W3C Trace Context standard defines traceparent for trace/span IDs; use custom x-* headers for application-specific IDs:
// HTTP header propagation
const correlationHeaders = {
  // W3C Trace Context (standard)
  traceparent: '00-4bf92f3577b34da6a3ce929d0e0e4736-00f067aa0ba902b7-01',
  tracestate: 'vendor=value',

  // Custom headers for non-trace IDs
  'x-request-id': 'req_abc123',
  'x-session-id': 'sess_xyz789',
  'x-transaction-id': 'order-12345',
  'x-causation-id': 'order_created_evt',
}The challenge: correlation context must be available to any code that logs or makes outbound calls, without explicitly passing it through every function. Node.js’s AsyncLocalStorage solves this by maintaining context across async boundaries:
// Express middleware for extraction and injection
import { AsyncLocalStorage } from 'async_hooks'

interface RequestContext {
  traceId: string
  spanId: string
  requestId: string
  sessionId?: string
  transactionId?: string
}

const contextStorage = new AsyncLocalStorage<RequestContext>()

function correlationMiddleware(req: Request, res: Response, next: NextFunction) {
  // Extract or generate IDs
  const traceHeader = req.headers['traceparent'] as string
  const { traceId, spanId } = parseTraceParent(traceHeader) || {
    traceId: generateTraceId(),
    spanId: generateSpanId()
  }

  const context: RequestContext = {
    traceId,
    spanId,
    requestId: req.headers['x-request-id'] as string || generateRequestId(),
    sessionId: req.headers['x-session-id'] as string,
    transactionId: req.headers['x-transaction-id'] as string,
  }

  // Set response headers for debugging
  res.setHeader('x-trace-id', traceId)
  res.setHeader('x-request-id', context.requestId)

  // Run request with context
  contextStorage.run(context, () => next())
}

// Get current context from anywhere
function getCorrelationContext(): RequestContext | undefined {
  return contextStorage.getStore()
}The middleware above handles extraction — pulling correlation IDs from incoming requests. But that’s only half the story. You also need injection — adding correlation IDs to outbound requests. Here’s a fetch wrapper that does that automatically:
// HTTP client that propagates context
async function fetchWithCorrelation(url: string, options: RequestInit = {}) {
  const context = getCorrelationContext()

  const headers = new Headers(options.headers)

  if (context) {
    // Generate new span ID for outbound call (same trace, new span)
    headers.set('traceparent', formatTraceParent(context.traceId, generateSpanId()))
    headers.set('x-request-id', context.requestId)
    if (context.sessionId) headers.set('x-session-id', context.sessionId)
    if (context.transactionId) headers.set('x-transaction-id', context.transactionId)
  }

  return fetch(url, { ...options, headers })
}Every HTTP client in your codebase must propagate correlation headers. A single direct fetch() call breaks the trace chain. Wrap your HTTP clients or use instrumentation libraries like OpenTelemetry’s auto-instrumentation to ensure consistency.
Message Queue Correlation
Async messaging requires correlation context embedded in the message envelope itself, since HTTP headers don’t exist. Messages also track causation — which previous message or request triggered them:
// Message envelope carries correlation through queues
interface MessageEnvelope<T> {
  messageId: string
  timestamp: string
  type: string
  correlation: {
    traceId: string
    causationId: string       // What triggered this message
    originRequestId?: string  // Original HTTP request that started the chain
  }
  payload: T
}

// Producer: wrap payload with correlation from current context
async function publishEvent<T>(type: string, payload: T): Promise<void> {
  const ctx = getCorrelationContext()
  const envelope: MessageEnvelope<T> = {
    messageId: generateMessageId(),
    timestamp: new Date().toISOString(),
    type,
    correlation: {
      traceId: ctx?.traceId || generateTraceId(),
      causationId: ctx?.causationId || 'http_request',
      originRequestId: ctx?.requestId,
    },
    payload,
  }
  await messageQueue.publish(type, envelope)
}

// Consumer: restore correlation before processing
async function handleMessage<T>(envelope: MessageEnvelope<T>): Promise<void> {
  const context: RequestContext = {
    traceId: envelope.correlation.traceId,
    spanId: generateSpanId(),
    causationId: envelope.messageId,  // This message is now the cause of downstream work
  }

  await contextStorage.run(context, () => processMessage(envelope.payload))
}Correlation Anti-Patterns
I’ve seen all of these break correlation in production. Each one creates gaps in your trace data that make debugging harder:
| Anti-Pattern | Why It Breaks | Solution |
|---|---|---|
| Generating new trace IDs per service | Logs can't be joined across services | Extract incoming traceparent; generate only if missing |
| Logging outside AsyncLocalStorage | Logs lack correlation context | Run all request handlers within contextStorage.run() |
| Direct HTTP client usage | Outbound calls don't propagate headers | Use fetchWithCorrelation() or OpenTelemetry auto-instrumentation |
| Fire-and-forget async | Background work loses context | Capture context before spawning; restore in async handler |
| Batched message processing | All messages share one correlation | Process each message in its own contextStorage.run() scope |
Test correlation by making a request, collecting logs from all services, and verifying they share the same trace.id. If any service’s logs are missing from the trace, you have a propagation gap. Automated tests should verify this on every deployment.
Logger Implementation Patterns
Schema compliance requires enforcement, not just documentation. Developers under deadline pressure will log whatever’s convenient — console.log('user:', user) is faster than constructing an ECS-compliant object. The solution is making the right thing the easy thing: build loggers that enforce schema compliance by default, so developers get it right without extra effort.
Type-Safe Logger Factory
TypeScript’s type system can catch schema violations at compile time. By defining interfaces for log field groups and requiring them in method signatures, you shift validation from runtime (where it’s often skipped) to build time (where it can’t be ignored). Here’s the foundation — interfaces that map to ECS field groups:
// Type definitions enforce ECS compliance at compile time
interface HttpLogFields {
  'http.request.method': string
  'http.request.path': string
  'http.response.status_code': number
  'http.response.time_ms': number
}

class StructuredLogger {
  private baseFields: Record<string, unknown>

  constructor(config: { serviceName: string; serviceVersion: string }) {
    this.baseFields = {
      'service.name': config.serviceName,
      'service.version': config.serviceVersion,
    }
  }

  private log(level: string, message: string, fields: Record<string, unknown>) {
    const context = getCorrelationContext()
    const entry = {
      '@timestamp': new Date().toISOString(),
      'log.level': level,
      message,
      ...this.baseFields,
      ...(context && { 'trace.id': context.traceId, 'span.id': context.spanId }),
      ...fields,
    }
    console.log(JSON.stringify(entry))
  }

  info(message: string, fields?: Record<string, unknown>) {
    this.log('info', message, fields || {})
  }

  error(message: string, error: Error, fields?: Record<string, unknown>) {
    this.log('error', message, {
      'error.type': error.name,
      'error.message': error.message,
      'error.stack_trace': error.stack,
      ...fields,
    })
  }

  // Typed method: missing http.response.status_code = compile error
  httpRequest(message: string, fields: HttpLogFields & Record<string, unknown>) {
    this.log('info', message, { 'event.category': ['web'], ...fields })
  }

  // Child logger inherits base fields + adds new ones
  child(fields: Record<string, unknown>): StructuredLogger {
    const child = Object.create(this)
    child.baseFields = { ...this.baseFields, ...fields }
    return child
  }
}The child() pattern is powerful for domain contexts — create a child logger when entering an operation, and all logs inherit the bound fields:
// Usage
const logger = new StructuredLogger({
  serviceName: 'order-service',
  serviceVersion: '1.2.3',
})

const orderLogger = logger.child({ 'order.id': 'ord_12345' })

orderLogger.httpRequest('Order created', {
  'http.request.method': 'POST',
  'http.request.path': '/api/orders',
  'http.response.status_code': 201,
  'http.response.time_ms': 45,
  'event.action': 'order_created',
})Request-Scoped Logging
The child logger pattern works well for domain contexts, but every HTTP handler has the same boilerplate: extract correlation context, add request metadata, bind user info. Instead of repeating that everywhere, create a request-scoped logger in middleware that handlers can use directly:
// Middleware creates a pre-configured logger for each request
function loggingMiddleware(req: Request, res: Response, next: NextFunction) {
  const context = getCorrelationContext()
  const startTime = Date.now()

  // Create logger with all request context pre-bound
  req.log = logger.child({
    'http.request.method': req.method,
    'http.request.path': req.path,
    'trace.id': context?.traceId,
    'span.id': context?.spanId,
    ...(req.user && { 'user.id': req.user.id }),
  })

  req.log.info('Request started', { 'event.action': 'http_request_started' })

  res.on('finish', () => {
    req.log.httpRequest('Request completed', {
      'http.request.method': req.method,
      'http.request.path': req.path,
      'http.response.status_code': res.statusCode,
      'http.response.time_ms': Date.now() - startTime,
      'event.outcome': res.statusCode < 400 ? 'success' : 'failure',
    })
  })

  next()
}Now handlers just call req.log.info() without worrying about context:
app.post('/api/orders', async (req, res) => {
  req.log.info('Processing order', { 'order.item_count': req.body.items.length })

  const order = await createOrder(req.body)
  req.log.info('Order created', { 'order.id': order.id, 'event.action': 'order_created' })

  res.status(201).json(order)
})This pattern works with Express, Fastify, Koa, and Hapi. The key is attaching the logger early and capturing response details in a completion callback.
Sensitive Data Handling
You’ve standardized your schema and implemented correlation IDs. Now every service emits queryable, traceable logs. But there’s a catch: structured logging makes data leaks easier.
When everything was unstructured text, finding sensitive data required reading logs manually. Now a single query like user.email:* returns every log containing email addresses. That’s powerful for debugging — and catastrophic if logs are compromised.
The goal isn’t eliminating sensitive data from logs entirely. Sometimes you need an email address to debug a user-specific issue. The goal is deliberate handling: know what’s being logged, who can access it, how long it’s retained, and whether it can be recovered if needed.
Redaction Strategies
Different data requires different treatment. Passwords should never appear — not even hashed. Email addresses might be partially masked for debugging while protecting the full value. Some fields need to be recoverable by security teams investigating fraud.
The redactor walks through log objects applying appropriate strategies based on field names. Pattern matching catches common sensitive fields; specific masking rules handle emails, phones, and card numbers:
class LogRedactor {
  private sensitivePatterns = /password|secret|key|token|auth|credential/i

  redact(obj: Record<string, unknown>): Record<string, unknown> {
    const result: Record<string, unknown> = {}

    for (const [key, value] of Object.entries(obj)) {
      if (this.sensitivePatterns.test(key)) {
        result[key] = '[REDACTED]'
      } else if (typeof value === 'object' && value !== null) {
        result[key] = this.redact(value as Record<string, unknown>)
      } else if (typeof value === 'string') {
        result[key] = this.maskValue(key, value)
      } else {
        result[key] = value
      }
    }
    return result
  }

  private maskValue(key: string, value: string): string {
    if (key.includes('email')) {
      const [local, domain] = value.split('@')
      return `${local[0]}***@${domain}`
    }
    if (key.includes('phone') || key.includes('card')) {
      return value.replace(/\d(?=\d{4})/g, '*')
    }
    return value
  }
}Field-Level Encryption
Some fields need to be recoverable — customer addresses for fraud investigations, transaction details for dispute resolution. For these, use AES-256-GCM encryption with key IDs that enable rotation:
class FieldEncryptor {
  constructor(private key: Buffer, private keyId: string) {}

  encrypt(value: string): EncryptedField {
    const iv = randomBytes(16)
    const cipher = createCipheriv('aes-256-gcm', this.key, iv)
    const encrypted = cipher.update(value, 'utf8', 'base64') + cipher.final('base64')

    return {
      _encrypted: true,
      keyId: this.keyId,
      iv: iv.toString('base64'),
      authTag: cipher.getAuthTag().toString('base64'),
      ciphertext: encrypted,
    }
  }
}

// Usage: combine masking and encryption
logger.info('Customer registered', {
  'user.id': userId,
  'customer.email': redactor.maskEmail(email),       // Masked: debuggable
  'customer.address': encryptor.encrypt(address),    // Encrypted: recoverable
})Passwords, API keys, tokens, and secrets should never appear in logs — not even hashed or encrypted. There’s no legitimate debugging need for them. If they’re appearing in logs, the logging location is wrong.
Collector-Side Processing
Application-level redaction catches most sensitive data, but defense in depth requires collector-side processing too. Log pipelines can catch data that slips through application controls, enrich logs with infrastructure context, and route logs to appropriate destinations based on content.
Log Pipeline Architecture
Modern log architectures have three tiers: shippers that collect logs from applications, processors that transform and route them, and storage that serves different query patterns.
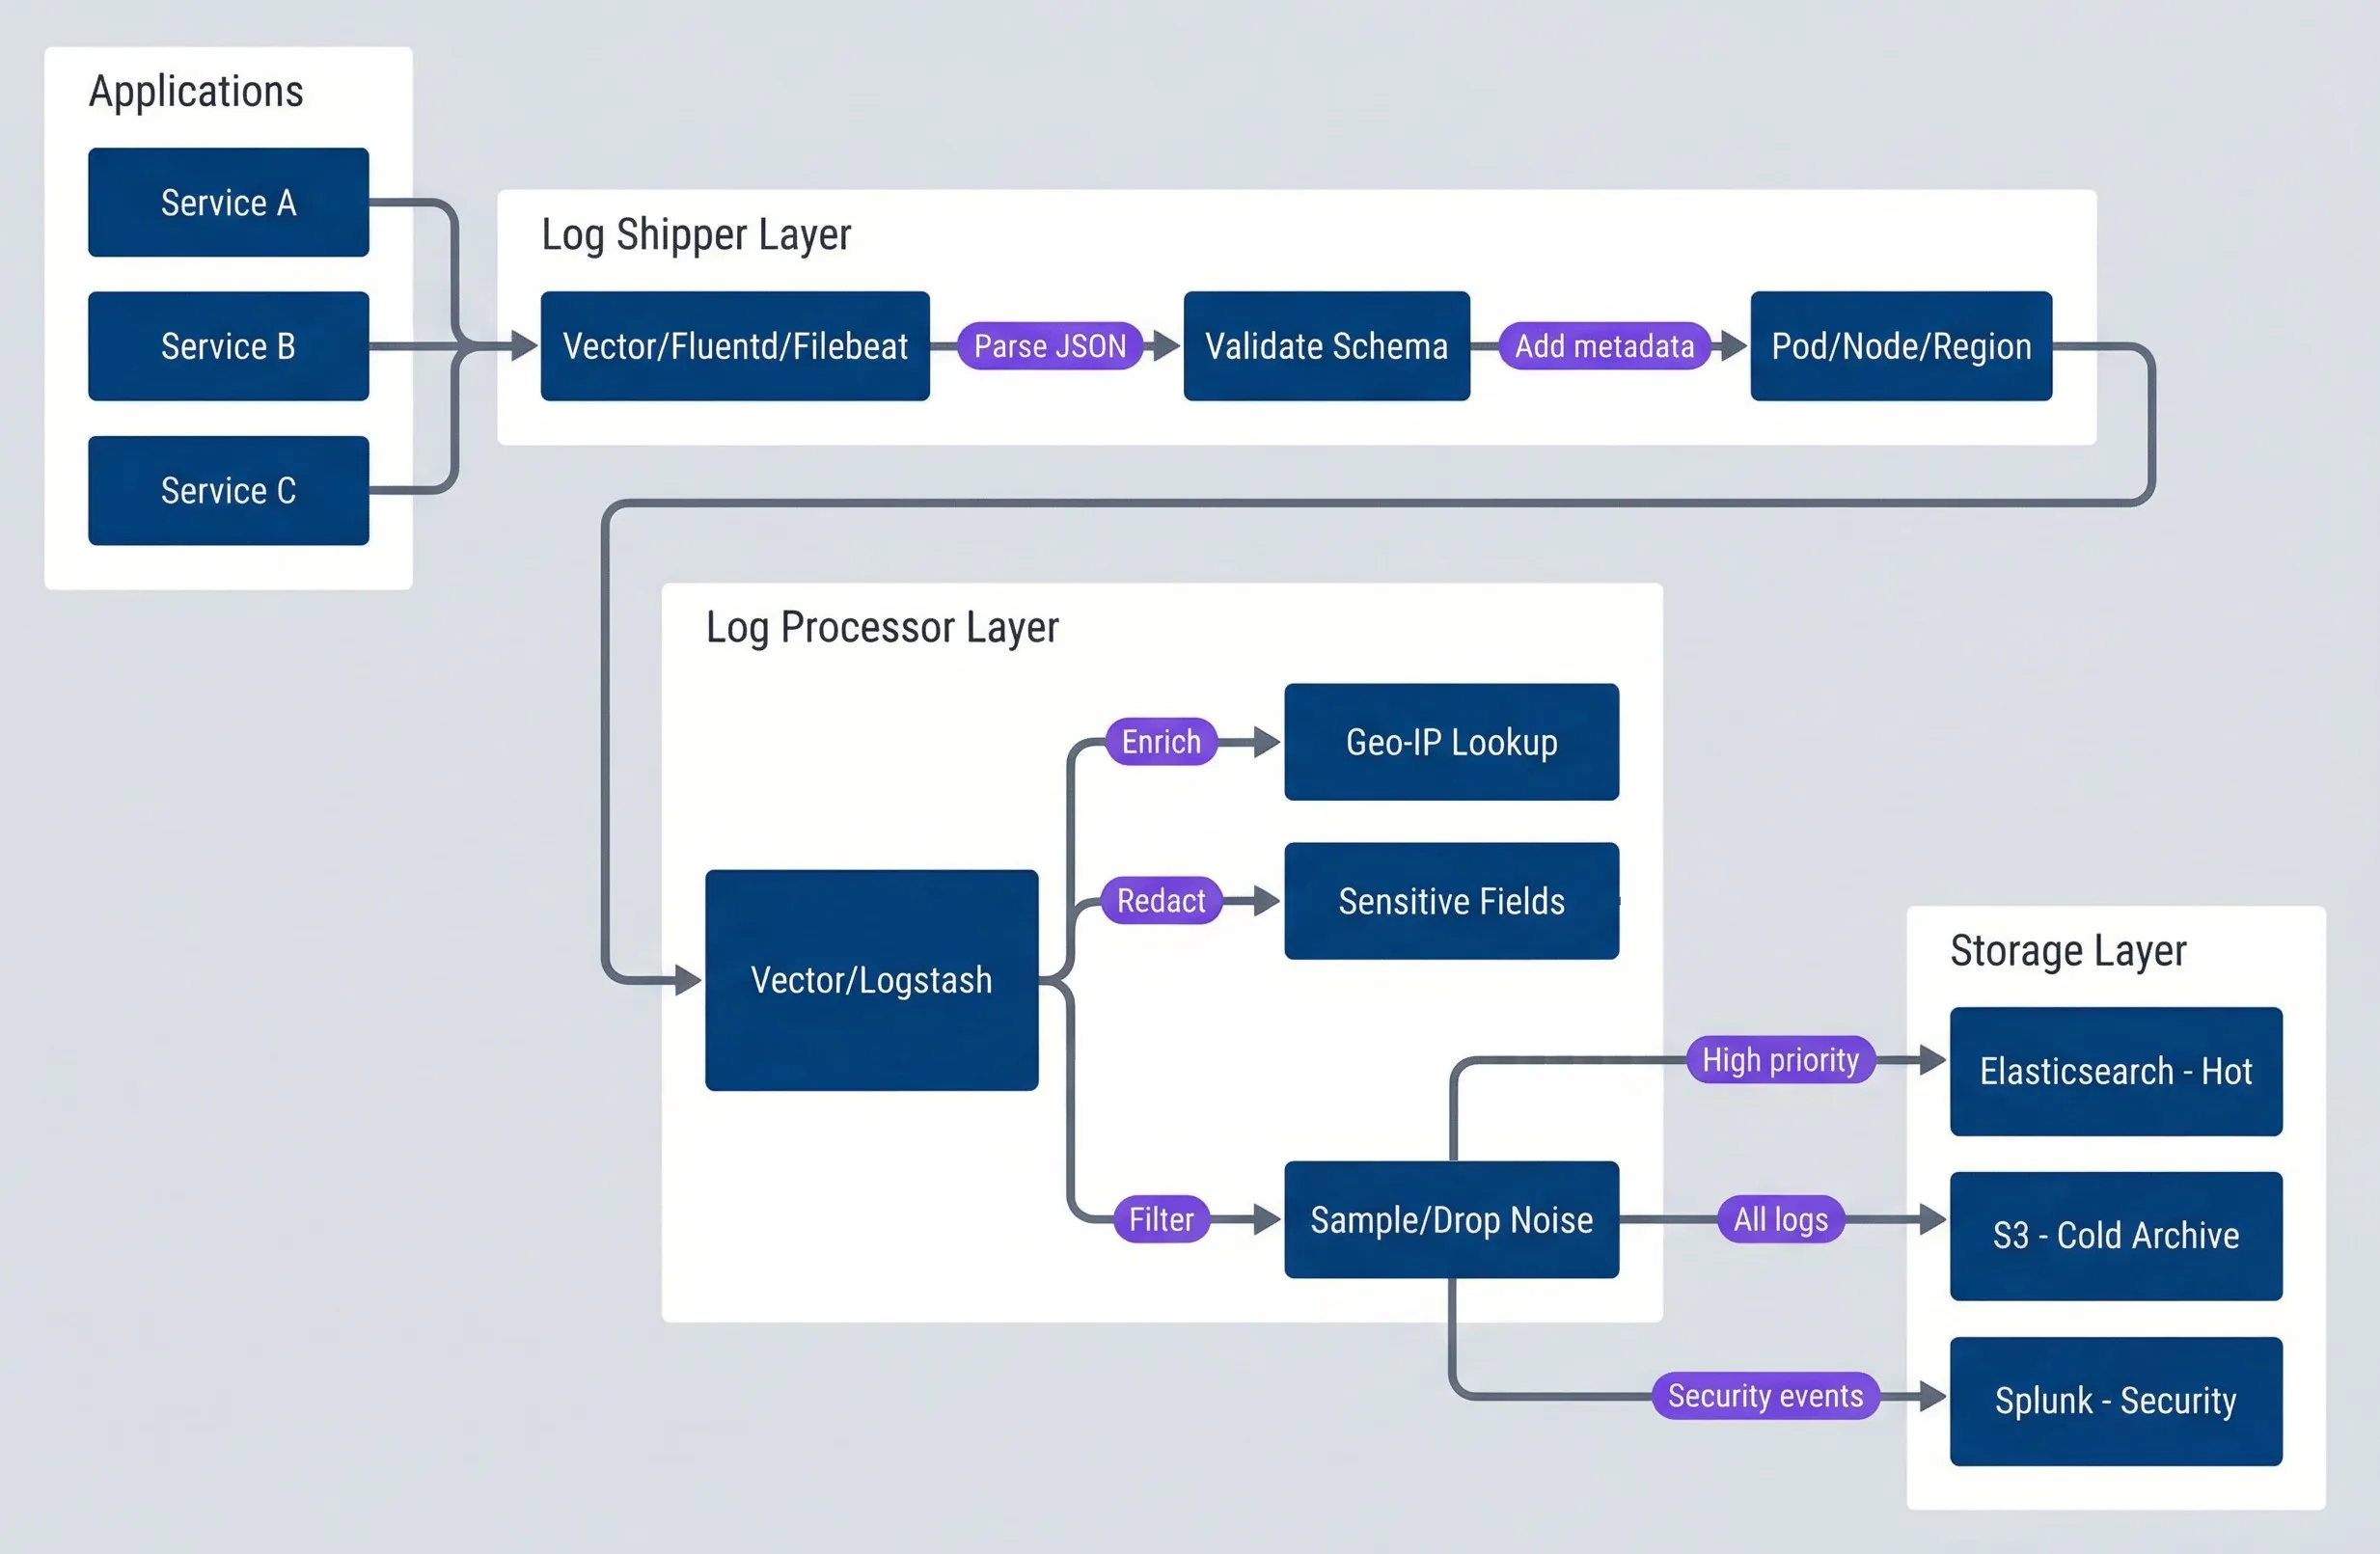
Log pipeline architecture.description
A top-to-bottom flowchart describing a three-layer log pipeline. The first subgraph, "Applications," contains Service A, Service B, and Service C, all sending logs into a shared shipper. The second subgraph, "Log Shipper Layer," contains Vector, Fluentd, or Filebeat, which first parses JSON and then validates the schema before adding infrastructure metadata such as pod, node, and region. The output flows into the third processing stage, "Log Processor Layer," where Vector or Logstash enriches records with Geo-IP lookup data, redacts sensitive fields, and filters or samples noisy events. The final subgraph, "Storage Layer," contains three destinations: Elasticsearch hot storage for high-priority logs, S3 cold archive for all logs, and Splunk for security events. Arrows show the same processed stream being routed to different destinations based on access pattern and log purpose.
Noise Reduction Strategies
Not all logs deserve storage. Health checks fire every few seconds and rarely matter. Debug logs in production are noise by definition. Cache hits happen thousands of times per minute but add little debugging value. The goal is dropping low-value logs while keeping everything that might matter during an incident.
This framework helps decide how to handle different log patterns. The “Connection events” row uses aggregation — the same technique shown in the code example that follows:
| Pattern | Action | Rationale |
|---|---|---|
| Health checks (/health, /ready) | Drop | High volume, rarely useful for debugging |
| Metrics endpoint requests | Drop | Already captured in metrics, redundant |
| Debug logs in production | Drop | Should never reach production storage |
| Cache hits | Sample (1%) | Keep trend visibility, reduce volume |
| Connection events | Aggregate | Count per minute, not individual events |
| All errors | Keep | Every error is valuable for debugging |
| Authentication events | Keep | Security-relevant, audit requirements |
For high-volume events that still have value, aggregation preserves information while dramatically reducing storage. Instead of 1,000 individual connection logs per minute, emit one aggregated log:
// Aggregation: count instead of individual logs
interface AggregatedLog {
  '@timestamp': string
  'log.level': 'info'
  'message': string
  'event.action': string
  'aggregation.count': number
  'aggregation.window_seconds': number
}

// Instead of 1000 "connection_opened" logs per minute:
const aggregatedConnectionLog: AggregatedLog = {
  '@timestamp': '2024-01-15T14:31:00Z',
  'log.level': 'info',
  'message': 'Database connections aggregated',
  'event.action': 'db_connection_aggregated',
  'aggregation.count': 1247,
  'aggregation.window_seconds': 60,
}Be cautious with sampling and dropping. Start conservative — drop only the logs you’re certain have no debugging value. You can always drop more later, but you can’t recover logs you never stored.
Schema Governance and Evolution
A schema is only useful if everyone follows it. Without governance, you’ll have teams inventing their own field names, breaking consumers, and defeating the purpose of standardization. But governance can’t be so heavy that teams can’t add the fields they need.
Schema Registry Options
You need a central source of truth for field definitions — what fields exist, their types, who owns them, and whether they’re deprecated. Unfortunately, there’s no dominant open source “log schema registry” the way there’s a Confluent Schema Registry for Kafka. Your options:
- Use your log platform's native schema management.Elasticsearch has index templates and component templates that define field mappings. DataDog has facets. Splunk has field extractions. These work well if you're single-platform, but they're vendor-specific and don't help at log-emit time.
- JSON Schema in your repo.Define your schema as JSON Schema files, validate in CI (we'll cover this in the Testing section), and generate documentation from the schema. This is lightweight and works across platforms.
- Build a lightweight registry service.For larger organizations, a simple service that stores field definitions with ownership and versioning metadata. This does not need to be complex-a YAML file in a shared repo with a PR review process often suffices.
The key insight: the format of your registry matters less than having one at all and enforcing it in CI. A YAML file that every service validates against beats a sophisticated registry that nobody uses.
If you’re using ECS, you already have a schema — the ECS field reference is your registry for standard fields. You only need to document custom fields you’ve added.
Schema Evolution Process
Schemas change — new features need new fields, old patterns get replaced. The key is managing change without breaking consumers. Here’s the evolution process that’s worked for me:
| Phase | Duration | Action |
|---|---|---|
| Proposal | 1 week | RFC for new field, review by platform team |
| Addition | Immediate | Add field as optional, update registry |
| Adoption | 2-4 weeks | Teams start using new field |
| Promotion | After adoption | Consider making field required if universal |
| Deprecation Notice | 1 month | Mark field deprecated, log warnings |
| Migration Period | 3 months | Teams migrate to replacement field |
| Removal | After migration | Remove field from registry, update parsers |
New fields must be optional. Parsers must ignore unknown fields. Type changes require a new field name. These rules keep old logs queryable and prevent producer/consumer version coupling.
Testing and Validating Your Logging
Everything we’ve covered — schemas, correlation, redaction — needs automated verification. Manual code review doesn’t catch the developer who logs userId instead of user.id. CI tests do.
You need two things: tests that fail when logs violate the schema, and production monitoring that catches correlation gaps.
Schema Validation in CI
Use JSON Schema and Ajv to validate log output in unit tests. The pattern: capture log output, parse it, validate against your schema:
import { describe, it, expect, beforeEach, vi } from 'vitest'
import Ajv from 'ajv'
import addFormats from 'ajv-formats'

const ecsLogSchema = {
  type: 'object',
  required: ['@timestamp', 'log.level', 'message', 'service.name'],
  properties: { '@timestamp': { type: 'string', format: 'date-time' } },
  additionalProperties: true,
}

describe('Structured Logger Schema Compliance', () => {
  let logOutput: string[] = []
  const validate = new Ajv({ allErrors: true }).addFormats(addFormats).compile(ecsLogSchema)

  beforeEach(() => {
    logOutput = []
    vi.spyOn(console, 'log').mockImplementation((msg: string) => logOutput.push(msg))
  })

  it('emits valid ECS-compliant logs', () => {
    logger.info('Test message', { 'user.id': 'usr_123' })
    const entry = JSON.parse(logOutput[0])

    expect(validate(entry)).toBe(true)
    expect(entry['@timestamp']).toMatch(/^\d{4}-\d{2}-\d{2}T/)
  })

  it('includes trace context when available', () => {
    logger.info('With trace', {
      'trace.id': '4bf92f3577b34da6a3ce929d0e0e4736',
      'span.id': '00f067aa0ba902b7',
    })
    const entry = JSON.parse(logOutput[0])

    expect(entry['trace.id']).toMatch(/^[a-f0-9]{32}$/)
    expect(entry['span.id']).toMatch(/^[a-f0-9]{16}$/)
  })
})Correlation ID Propagation Tests
Correlation is only useful if it propagates correctly. Test that trace IDs survive HTTP boundaries — both inbound extraction and outbound propagation:
describe('Correlation ID Propagation', () => {
  it('extracts trace context from W3C traceparent header', async () => {
    const req = createMockRequest({
      headers: { traceparent: '00-4bf92f3577b34da6a3ce929d0e0e4736-00f067aa0ba902b7-01' },
    })

    await new Promise<void>(resolve => {
      correlationMiddleware(req, createMockResponse(), () => {
        expect(getCorrelationContext()?.traceId).toBe('4bf92f3577b34da6a3ce929d0e0e4736')
        resolve()
      })
    })
  })

  it('generates IDs when headers are missing', async () => {
    const req = createMockRequest({ headers: {} })

    await new Promise<void>(resolve => {
      correlationMiddleware(req, createMockResponse(), () => {
        expect(getCorrelationContext()?.traceId).toMatch(/^[a-f0-9]{32}$/)
        resolve()
      })
    })
  })

  it('propagates context to outbound requests', async () => {
    const mockFetch = vi.fn().mockResolvedValue(new Response('{}'))
    const testContext = { traceId: '4bf92f3577b34da6a', spanId: '00f067aa', requestId: 'req_123' }

    await contextStorage.run(testContext, () =>
      fetchWithCorrelation('https://api.example.com', {}, mockFetch)
    )

    expect(mockFetch.mock.calls[0][1].headers.get('traceparent')).toContain(testContext.traceId)
  })
})Log Quality Metrics
In production, monitor log quality the same way you monitor application health. Three Prometheus counters give you visibility into schema compliance and correlation coverage:
- 1log_schema_validation_total{result, service}Counts valid vs. invalid log entries
- 2log_schema_violations_total{field, violation_type, service}Tracks which fields fail and why
- 3log_missing_correlation_total{service, log_location}Flags logs without trace IDs
Hook these counters into your logger’s output path to track every log entry. Alert when violation rates spike or correlation coverage drops below your target (e.g., 99% of logs should have trace IDs).
Set a correlation coverage target (e.g., 99% of logs must have trace IDs) and alert when it drops. Missing correlation IDs usually indicate logging from outside the request context — background jobs, startup code, or improperly instrumented libraries.
Conclusion
Structured logging at scale requires discipline across three dimensions: schema consistency, correlation propagation, and noise management.
Adopt ECS rather than inventing a schema — it handles most use cases and enables cross-organization tooling compatibility. Implement correlation IDs at every boundary: HTTP headers for synchronous calls, message envelopes for async, and AsyncLocalStorage for automatic propagation within services. Redact sensitive data at the source, not the sink — assume logs will be accessed by anyone with read permissions.
Use collector-side processing to filter noise before storage: drop health checks and debug logs, sample high-volume events, aggregate repetitive patterns. Establish schema governance early; field naming decisions made in month one will constrain querying for years.
The next time it’s 3 AM and you’re chasing a bug across twelve services, you’ll type one query instead of five — and you won’t miss the inventory service.
Footnotes
-
Pino is an extremely fast, low-overhead, and lightweight logger for Node.js applications, designed to minimize performance impact through asynchronous logging. It produces structured JSON logs by default, making it ideal for production environments, observability platforms, and log aggregation tools.
↩
Sharethisarticle
Enjoyed the read? Share it with your network.




