
Pod Sizing: Requests, Limits, and QoS Classes


Table of Contents
Every pod in Kubernetes consumes CPU and memory, but how you declare those resources determines where pods land, how they behave under pressure, and which pods die when nodes run low. Requests and limits aren’t optional settings you can figure out later — they’re the contract between your workload and the cluster. Get them wrong and you’ll face wasted capacity (over-requesting), noisy neighbor problems (under-limiting), or surprise evictions (mismatched QoS classes).
Here’s a scenario I’ve seen multiple times: a production cluster with 10 nodes starts experiencing random pod evictions at 3 AM. Investigation reveals memory pressure on several nodes—60% of pods have no memory limits, so a few memory-hungry pods consumed all available RAM. The pods being evicted aren’t the resource hogs. They’re the well-behaved ones that set requests but no limits, making them “Burstable” QoS and first in line for eviction.
The most common resource mistake: setting requests without limits (or vice versa). This creates Burstable QoS pods that can be evicted before pods with no resource specs at all. Understanding QoS classes is essential for production workloads.
The lesson: QoS class determines eviction order, and most teams don’t realize what class their pods belong to until they’re debugging an outage.
The Resource Model
Requests vs Limits
Kubernetes has two resource dimensions that serve different purposes. Requests tell the scheduler how much capacity a pod needs — the scheduler won’t place a pod on a node unless that much capacity is available. Limits tell the kernel the maximum a pod can use — exceed the limit and enforcement kicks in.
apiVersion: v1
kind: Pod
metadata:
  name: api-server
spec:
  containers:
    - name: app
      image: api-server:v1.2.0
      resources:
        requests:
          cpu: "250m"      # 0.25 CPU cores - scheduling guarantee
          memory: "256Mi"  # 256 MiB - scheduling guarantee
        limits:
          cpu: "1000m"     # 1 CPU core - hard ceiling
memory: "512Mi" # 512 MiB - hard ceilingThe key insight: requests affect where pods run, limits affect how pods run once scheduled. The scheduler sums up all requests on a node and won’t over-commit beyond allocatable capacity. But limits are enforced at runtime by the kernel — a pod can burst above its request (using spare capacity) until it hits its limit. This split creates flexibility: you can request 256Mi (your baseline need) but set a 512Mi limit (your peak need), letting pods burst when memory is available without reserving peak capacity on every node.
CPU Behavior
CPU is a compressible resource. When a pod exceeds its CPU limit, Kubernetes doesn’t kill it — it throttles it. The pod runs slower, but it keeps running.
Under the hood, CPU limits use Linux’s Completely Fair Scheduler (CFS) quotas. The kernel gives each container a time budget per scheduling period (typically 100ms). A pod with a 500m CPU limit gets 50ms of CPU time per 100ms period. Use it up and the pod waits until the next period.
The symptoms of CPU throttling are subtle: increased latency during traffic spikes, timeouts on CPU-bound operations, slow container startup, and health check failures. Unlike OOM kills, there’s no clear error message — just degraded performance.
You can detect throttling with Prometheus:
# Throttling percentage - values above 25% indicate a problem
sum(rate(container_cpu_cfs_throttled_periods_total[5m]))
/ sum(rate(container_cpu_cfs_periods_total[5m])) * 100The common CPU mistakes: under-requesting causes pods to steal CPU from neighbors (the scheduler didn’t know they needed it). Over-requesting wastes cluster capacity. Setting limits too low causes throttling during legitimate traffic spikes. I’ve seen teams set CPU limits equal to requests “for predictability” and then wonder why their services time out under load — they’d eliminated the ability to burst.
Memory Behavior
Memory is incompressible. When a pod exceeds its memory limit, there’s no graceful degradation — the kernel’s OOM killer terminates the process immediately. You’ll see exit code 137 and a Reason: OOMKilled in the pod status.
The OOM killer is ruthless. It doesn’t wait for graceful shutdown, doesn’t respect termination grace periods, and doesn’t care that you were in the middle of processing a request. The process just disappears.
# Check if a pod was OOM killed
kubectl describe pod api-server | grep -A5 "Last State"
# Look for: Reason: OOMKilled, Exit Code: 137Memory limits without headroom are time bombs. If your application normally uses 400Mi but occasionally peaks at 450Mi during garbage collection or traffic spikes, a 450Mi limit will eventually kill it. Set limits with at least 50% headroom above observed peak usage — memory OOM is not recoverable like CPU throttling.
The eviction angle matters too: pods without memory limits can consume all node memory, triggering node-level OOM that affects all pods on the node. This is why “no limits” is dangerous — one runaway pod can take down its neighbors.
| Resource | Type | Enforcement | Exceeded Behavior | Recovery |
|---|---|---|---|---|
| CPU | Compressible | CFS throttling | Slowed execution | Automatic |
| Memory | Incompressible | OOM kill | Pod termination | Restart |
Memory limits are a kill switch. If your application exceeds its memory limit even briefly, it gets OOM killed — no warning, no graceful shutdown. Always set memory limits with headroom above your application’s peak usage, not its average.
QoS Classes
Understanding the Three Classes
Kubernetes automatically assigns every pod a Quality of Service class based on its resource specification. This class determines eviction priority when nodes run low on resources. You don’t set the QoS class directly — it’s derived from how you configure requests and limits.
- 1GuaranteedThe highest priority class. To get it, every container in the pod must have requests and limits set for both CPU and memory, and the requests must equal the limits. These pods are evicted last.
- 2BurstableThe middle tier. Any pod with at least one resource request or limit, but that doesn't qualify for Guaranteed, falls here. This includes pods with requests only, limits only, or requests that don't match limits. Most production workloads end up Burstable.
- 3BestEffortThe lowest priority. Pods with no resource specifications at all — no requests, no limits on any container — get this class. They're evicted first under pressure.
# Guaranteed QoS: requests = limits for all resources
apiVersion: v1
kind: Pod
metadata:
  name: payment-processor
spec:
  containers:
    - name: app
      image: payment-processor:v2.1.0
      resources:
        requests:
          cpu: "500m"
          memory: "512Mi"
        limits:
          cpu: "500m"      # Same as request
memory: "512Mi" # Same as requestThe tricky part is that Burstable is a broad category. A pod with carefully tuned requests and limits is Burstable. A pod with only a CPU request and nothing else is also Burstable. They have the same QoS class but very different behavior.
# Burstable QoS: requests != limits
apiVersion: v1
kind: Pod
metadata:
  name: web-server
spec:
  containers:
    - name: app
      image: web-server:v1.0.0
      resources:
        requests:
          cpu: "250m"
          memory: "256Mi"
        limits:
          cpu: "1000m"     # Different from request (can burst)
memory: "512Mi" # Different from request (has headroom)BestEffort is what you get when a pod spec omits resource declarations entirely. Kubernetes treats these pods as disposable — they receive whatever capacity happens to be available, with no scheduling guarantees and no eviction protection. In practice, BestEffort pods are appropriate for truly ephemeral workloads: dev/test environments, batch jobs that checkpoint their progress, or background tasks where occasional restarts are acceptable. Running production services as BestEffort is dangerous because the kubelet will terminate them before touching any pod that declared even a single resource request.
# BestEffort QoS: no resources specified at all
apiVersion: v1
kind: Pod
metadata:
  name: batch-job
spec:
  containers:
    - name: app
      image: batch-processor:v1.0.0
      # No resources block - this pod is BestEffort
# Will be evicted first under node pressureThe QoS class assignment is entirely mechanical — there’s no annotation or field you can set to override it. Kubernetes inspects every container in the pod (including init containers for resource accounting) and applies a strict decision tree. This means a multi-container pod where one sidecar is missing its limits will drop the entire pod from Guaranteed to Burstable, even if the primary container is perfectly configured. Auditing QoS classes across a namespace with kubectl get pods -o custom-columns=NAME:.metadata.name,QOS:.status.qosClass is worth doing periodically, especially after adding sidecars or updating Helm charts that modify resource blocks.
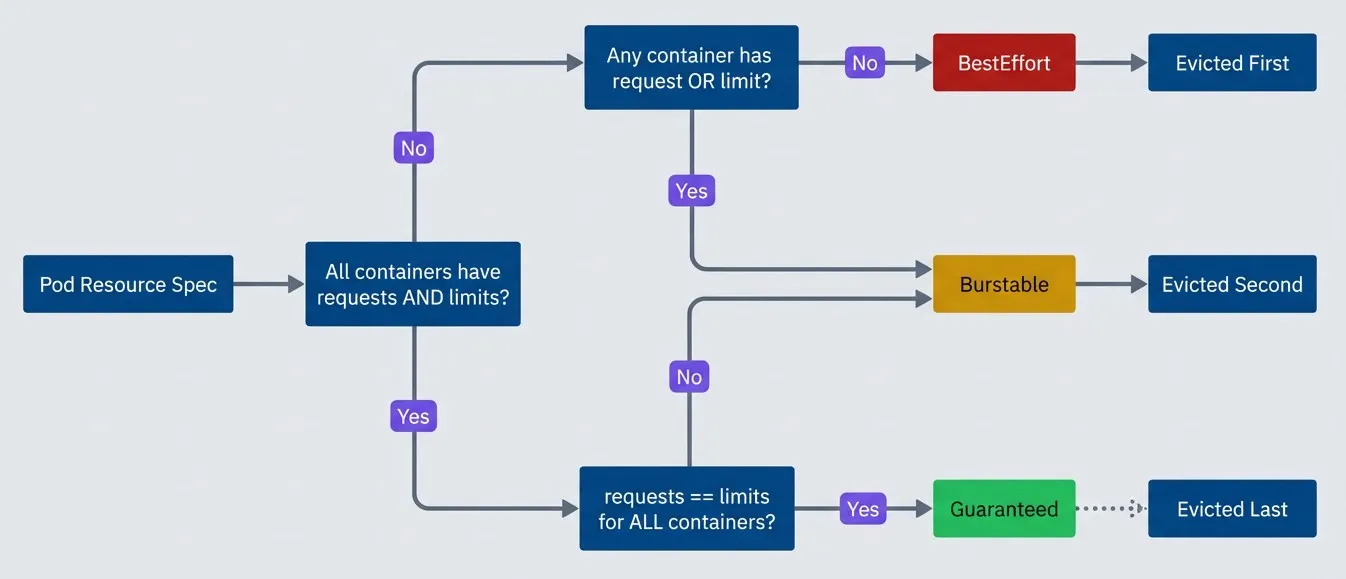
QoS class determination flow.description
Flowchart showing how Kubernetes derives a pod's Quality of Service class from its resource specification. The process starts at Pod Resource Spec and asks whether all containers have both requests and limits. If no, the chart asks whether any container has either a request or a limit. If that answer is no, the pod is classified as BestEffort and then labeled Evicted First. If that answer is yes, the pod is classified as Burstable and then labeled Evicted Second. If all containers do have both requests and limits, the chart asks whether requests equal limits for all containers. If no, the pod is classified as Burstable and then labeled Evicted Second. If yes, the pod is classified as Guaranteed and then labeled Evicted Last. The diagram visually emphasizes that BestEffort is the lowest-priority class, Burstable is the middle class, and Guaranteed is the highest-priority class for eviction order.
You can check a pod’s QoS class with kubectl get pod <name> -o yaml | grep qosClass. If you’re surprised by the result, remember that all containers in the pod must meet the Guaranteed criteria — one container without limits drops the whole pod to Burstable.
Eviction Behavior
When a node runs low on resources, the kubelet starts evicting pods. The eviction order follows QoS class, but there’s more nuance than “BestEffort first, Guaranteed last.”
The kubelet monitors several signals: memory.available, nodefs.available (disk), and pid.available. When any signal crosses its threshold (typically 100Mi for memory, 10% for disk), the node enters a pressure condition and eviction begins.
Within each QoS class, the kubelet prioritizes eviction based on resource usage relative to requests. The simplified formula for Burstable pods: (usage - request) / request. Pods using more memory relative to their request get evicted first. A pod using 200% of its memory request is evicted before one using 110%. (The actual eviction algorithm is more complex, incorporating priority classes and other factors.)
This creates a counterintuitive situation: a Burstable pod that set a low request but is using a lot of memory can be evicted before a BestEffort pod that happens to be using less. Accurate requests matter — they’re not just for scheduling, they’re also your eviction defense.
# Check if a node is under pressure
kubectl describe node <node-name> | grep -A5 Conditions
# Look for: MemoryPressure, DiskPressure, PIDPressure

# Find recently evicted pods
kubectl get events --field-selector reason=Evicted| # | QoS Class | Eviction Priority | Memory Enforcement | CPU Enforcement | Use Case |
|---|---|---|---|---|---|
| 1 | BestEffort | First (highest) | None | None | Dev/batch |
| 2 | Burstable | Middle | Limit (OOM) | Limit (throttle) | Most workloads |
| 3 | Guaranteed | Last (lowest) | Request=Limit | Request=Limit | Critical services |
The surprise: Burstable pods with requests but no limits can be evicted before BestEffort pods that happen to use less memory. The eviction algorithm considers actual usage relative to requests, not just QoS class. Size your requests accurately.
Common Misconfigurations
The Anti-Patterns
I’ve seen the same resource misconfigurations across dozens of clusters. Here are the patterns that cause the most operational pain:
- No resources at all.Pods without any resource specs get BestEffort QoS — first to be evicted, no scheduling guarantees, can consume unlimited node resources. This is the default if you don't specify anything, which is why so many teams accidentally run BestEffort pods in production.
- Requests only, no limits.This creates Burstable pods that can consume unbounded memory or CPU. A memory leak in one pod can starve its neighbors or trigger node-level OOM. The pod gets scheduled based on its request, but nothing stops it from using 10x that amount.
- Limits only, no requests.Kubernetes helpfully sets requests equal to limits when you only specify limits. The result is Guaranteed QoS, but you're probably over-reserving — the pod reserves its peak capacity even when it only needs a fraction of it. This wastes cluster capacity and increases costs.
Related pitfall: PodDisruptionBudget deadlocks. If you set minAvailable equal to your replica count, and all pods land on nodes that need draining (for upgrades or scaling), your PDB blocks all evictions — creating a deadlock. This interacts badly with resource settings because well-sized pods tend to pack onto fewer nodes, increasing the chance that a single node drain affects your entire deployment.
# Anti-pattern: requests without limits
apiVersion: apps/v1
kind: Deployment
metadata:
  name: web-service
spec:
  template:
    spec:
      containers:
        - name: app
          image: web-service:v1.0.0
          resources:
            requests:
              cpu: "100m"
              memory: "128Mi"
            # No limits - pod can consume unbounded resources
            # QoS: Burstable (can be evicted)
# Risk: memory leak takes down the nodeThe Correct Patterns
The right configuration depends on your workload type and tolerance for risk:
Critical services should use Guaranteed QoS. Set requests equal to limits for predictable performance and maximum eviction protection. The tradeoff is that you can’t burst — if you need 2x CPU during traffic spikes, you have to request 2x all the time.
# Pattern: Guaranteed QoS for critical services
apiVersion: apps/v1
kind: Deployment
metadata:
  name: payment-processor
spec:
  template:
    spec:
      containers:
        - name: app
          image: payment-processor:v2.1.0
          resources:
            requests:
              cpu: "500m"
              memory: "512Mi"
            limits:
              cpu: "500m"      # Same as request
memory: "512Mi" # Same as requestVariable workloads like web servers benefit from Burstable with headroom. Set limits higher than requests to allow bursting during traffic spikes while keeping baseline reservation efficient.
# Pattern: Burstable with headroom for web services
apiVersion: apps/v1
kind: Deployment
metadata:
  name: api-gateway
spec:
  template:
    spec:
      containers:
        - name: app
          image: api-gateway:v3.0.0
          resources:
            requests:
              cpu: "250m"      # Baseline need
              memory: "256Mi"  # Baseline need
            limits:
              cpu: "1000m"     # 4x burst for traffic spikes
memory: "512Mi" # 2x headroom for safetyMulti-container pods need careful attention. The pod’s QoS is determined by all containers — if your main container has requests=limits but your sidecar doesn’t, the whole pod is Burstable. Size sidecars explicitly.
# Pattern: Multi-container pod with explicit sidecar sizing
apiVersion: apps/v1
kind: Deployment
metadata:
  name: service-with-envoy
spec:
  template:
    spec:
      containers:
        - name: app
          image: my-service:v1.0.0
          resources:
            requests:
              cpu: "250m"
              memory: "256Mi"
            limits:
              cpu: "500m"
              memory: "512Mi"
        - name: envoy
          image: envoyproxy/envoy:v1.28.0
          resources:
            requests:
              cpu: "100m"
              memory: "64Mi"
            limits:
              cpu: "200m"
              memory: "128Mi"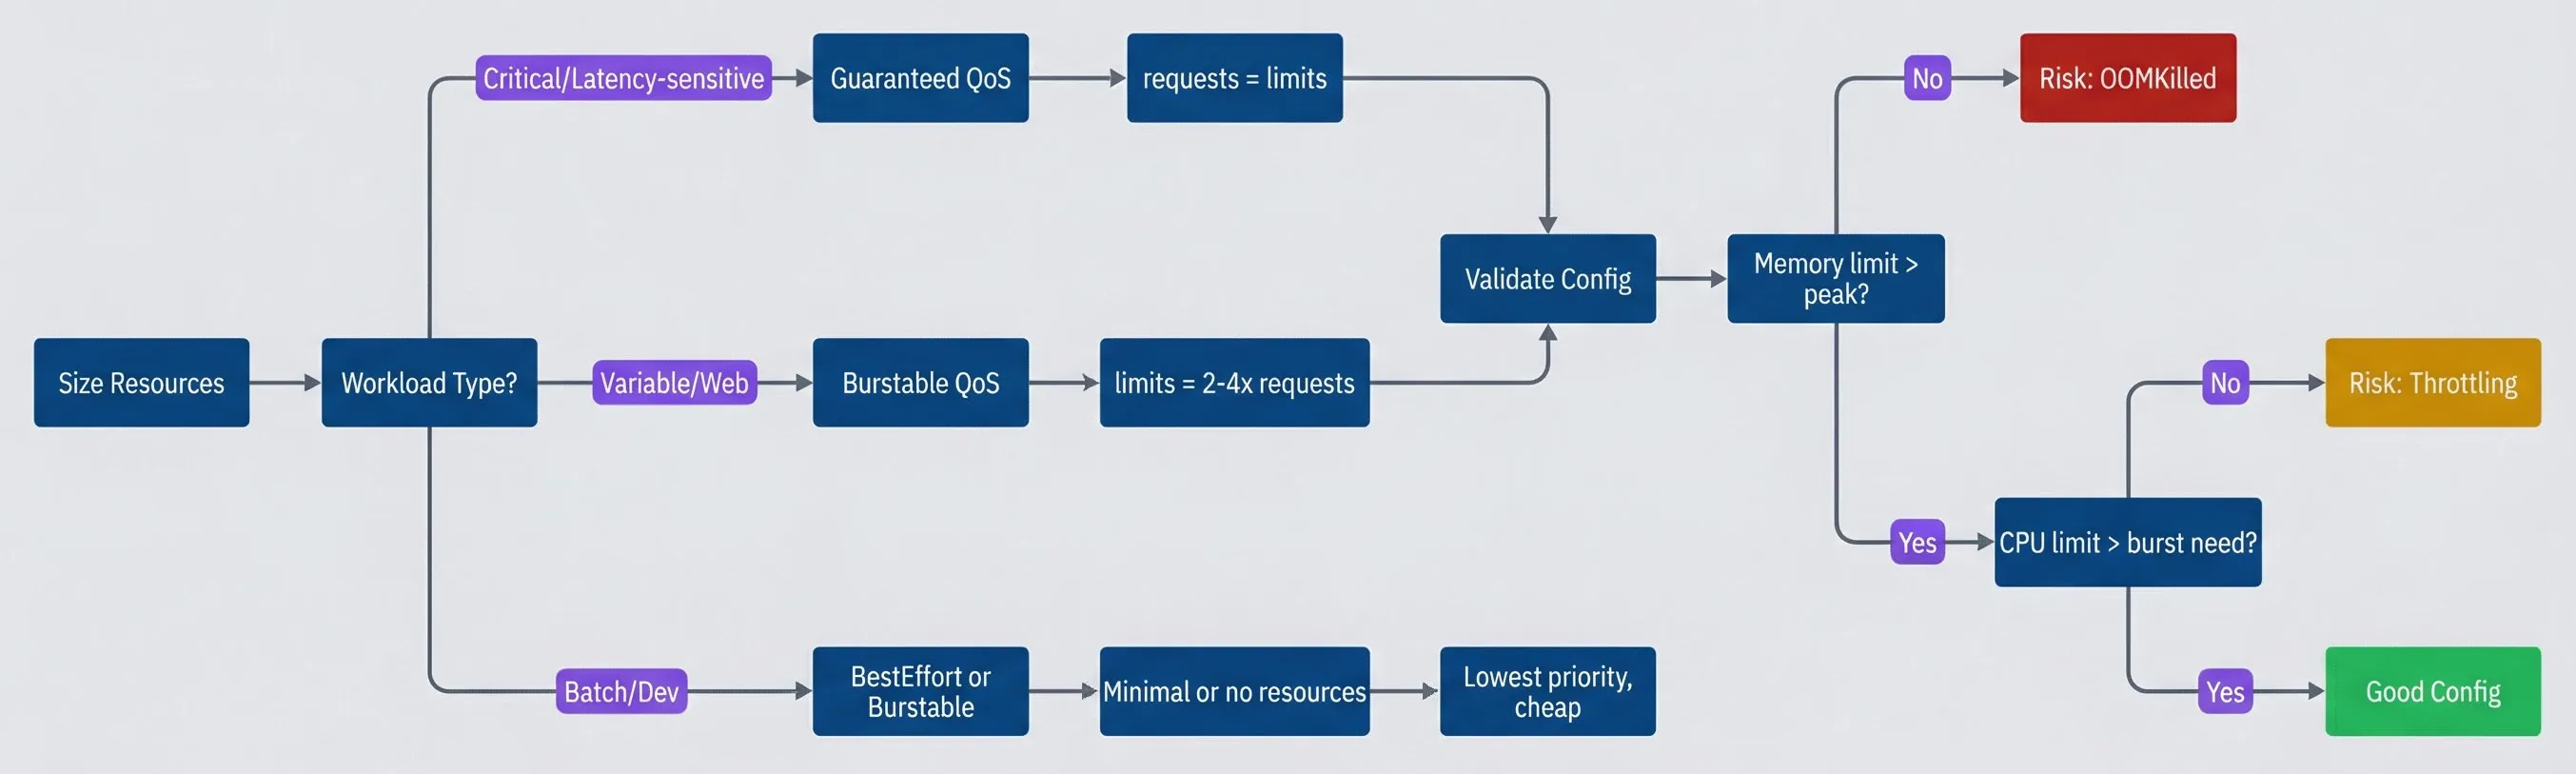
Resource sizing decision tree.description
Flowchart guiding the reader through pod resource sizing choices. The process starts at Size Resources and asks for the workload type. If the workload is Critical or Latency-sensitive, the chart recommends Guaranteed QoS, then requests = limits, then proceeds to Validate Config. If the workload is Variable or Web, the chart recommends Burstable QoS, then limits = 2-4x requests, then proceeds to Validate Config. If the workload is Batch or Dev, the chart recommends BestEffort or Burstable, then Minimal or no resources, then Lowest priority, cheap. From Validate Config, the chart asks whether memory limit is greater than peak usage. If no, the result is Risk: OOMKilled. If yes, it asks whether CPU limit is greater than burst need. If no, the result is Risk: Throttling. If yes, the result is Good Config. The diagram shows that workload type drives the initial sizing strategy, but every path still needs validation against observed memory peaks and CPU burst behavior to avoid runtime failures.
The rule of thumb: set CPU limits 2-4x requests (allow bursting), set memory limits 1.5-2x requests (headroom without waste). Monitor actual usage for two weeks, then right-size based on P95 metrics.
Right-Sizing with Data
Measuring Actual Usage
Guessing at resource values is how you end up with either OOM kills (too low) or wasted capacity (too high). The fix is measuring actual usage over time and sizing based on real data.
The key metrics come from Prometheus via cAdvisor1 and kube-state-metrics2. For CPU, you want the rate of container_cpu_usage_seconds_total. For memory, use container_memory_working_set_bytes—not RSS, which includes cached memory that can be reclaimed.
# CPU usage as percentage of request (identifies over/under-provisioning)
sum by (namespace, pod) (rate(container_cpu_usage_seconds_total[5m]))
/
sum by (namespace, pod) (kube_pod_container_resource_requests{resource="cpu"})
* 100The percentile you use matters. P50 tells you what’s normal. P95 tells you what you need to handle without degradation. Max tells you your peak burst need.
For requests, use P95 over a representative time window (at least 7 days to capture weekly patterns). For limits, use max plus a safety buffer—20% for CPU (throttling is recoverable), 50% for memory (OOM is not).
# P95 memory over 7 days - use for requests
quantile_over_time(0.95, container_memory_working_set_bytes[7d:1h])

# Max memory over 7 days + 50% buffer - use for limits
max_over_time(container_memory_working_set_bytes[7d:1h]) * 1.5VPA Recommendations
The Vertical Pod Autoscaler (VPA) automates this measurement. In “Off” mode, it watches your workloads and generates recommendations without making changes — perfect for right-sizing exercises.
# VPA in recommendation-only mode
apiVersion: autoscaling.k8s.io/v1
kind: VerticalPodAutoscaler
metadata:
  name: api-server-vpa
  namespace: production
spec:
  targetRef:
    apiVersion: apps/v1
    kind: Deployment
    name: api-server
  updatePolicy:
    updateMode: "Off"  # Generate recommendations only
  resourcePolicy:
    containerPolicies:
      - containerName: "*"
        minAllowed:
          cpu: "100m"
          memory: "128Mi"
        maxAllowed:
          cpu: "4000m"
memory: "8Gi"After a week or two of observation, check the recommendations:
kubectl describe vpa api-server-vpaThe VPA output includes several values: lowerBound (minimum safe), target (recommended for normal operation), and upperBound (recommended for spikes). A practical approach: use target for requests and upperBound with a buffer for limits.
| # | Metric | Use For | Calculation |
|---|---|---|---|
| 1 | P50 CPU | Baseline | Median usage |
| 2 | P95 CPU | Requests | Normal operation ceiling |
| 3 | Max CPU + 20% | Limits | Peak + buffer (throttling recoverable) |
| 4 | P95 Memory | Requests | Normal operation |
| 5 | Max Memory + 50% | Limits | Peak + buffer (OOM not recoverable) |
VPA in “Off” mode is your best friend. It watches your workloads and tells you what they actually need without making changes. Run it for two weeks, review recommendations, then apply manually. Only enable “Auto” mode when you trust the recommendations.
Namespace Defaults and Limits
LimitRange Configuration
Individual pod configurations are only half the story. Namespace-level controls give platform teams guardrails that apply to all workloads, even those deployed by teams who forget to set resources.
A LimitRange sets defaults and constraints for containers within a namespace. When a pod is created without resource specs, the LimitRange injects default values. When a pod requests too much or too little, the API rejects it.
apiVersion: v1
kind: LimitRange
metadata:
  name: default-limits
  namespace: production
spec:
  limits:
    - type: Container
      default:          # Applied as limits if not specified
        cpu: "500m"
        memory: "512Mi"
      defaultRequest:   # Applied as requests if not specified
        cpu: "100m"
        memory: "128Mi"
      min:              # Minimum allowed (rejects pods below this)
        cpu: "50m"
        memory: "64Mi"
      max:              # Maximum allowed (rejects pods above this)
        cpu: "4000m"
memory: "8Gi"The behavior is straightforward: deploy a pod without resources and it gets defaultRequest for requests and default for limits. Try to deploy a pod with 10Gi memory and the API rejects it because max is 8Gi. This converts accidental BestEffort pods into Burstable pods and prevents any single container from monopolizing node resources.
# Verify LimitRange is working
kubectl describe limitrange -n production

# Test: create pod without resources, check what it received
kubectl run test --image=nginx -n production
kubectl get pod test -o yaml | grep -A10 resourcesResourceQuota for Capacity
While LimitRange controls individual pods, ResourceQuota controls total namespace consumption. It caps the aggregate requests and limits across all pods in a namespace, preventing any single team from consuming the entire cluster.
apiVersion: v1
kind: ResourceQuota
metadata:
  name: production-quota
  namespace: production
spec:
  hard:
    requests.cpu: "50"          # 50 CPU cores total
    requests.memory: "100Gi"    # 100 GiB memory total
    limits.cpu: "100"           # 100 CPU cores limit total
    limits.memory: "200Gi"      # 200 GiB memory limit total
pods: "100" # Maximum 100 podsWhen a namespace hits its quota, new pods are rejected until existing pods are deleted or scaled down. You can check current usage with kubectl describe resourcequota -n production, which shows used vs. hard limits for each resource.
The combination matters: LimitRange ensures every pod has resources defined (no more accidental BestEffort), and ResourceQuota ensures the namespace doesn’t consume unlimited cluster capacity. Without both, you have gaps.
| Control | Scope | Purpose | Enforcement |
|---|---|---|---|
| LimitRange | Container/Pod | Defaults and bounds | Pod creation |
| ResourceQuota | Namespace | Total capacity | Object creation |
| PriorityClass | Cluster | Eviction order | Scheduling/eviction |
Always pair LimitRange with ResourceQuota. LimitRange ensures every pod has resources defined; ResourceQuota ensures the namespace doesn’t consume unlimited cluster capacity. Without both, you have gaps in your resource governance.
Monitoring and Alerting
Resource Utilization Dashboards
Right-sizing is an ongoing process, not a one-time exercise. Workloads change, traffic patterns shift, and code updates alter resource profiles. You need dashboards that continuously show request efficiency — actual usage compared to what you’ve reserved.
The core efficiency queries compare usage to requests at the namespace level:
# CPU efficiency: actual usage / requests (target: 50-80%)
sum by (namespace) (rate(container_cpu_usage_seconds_total[5m]))
/
sum by (namespace) (kube_pod_container_resource_requests{resource="cpu"})
* 100# Memory efficiency: actual usage / requests (target: 50-80%)
sum by (namespace) (container_memory_working_set_bytes)
/
sum by (namespace) (kube_pod_container_resource_requests{resource="memory"})
* 100Efficiency under 50% means you’re over-provisioned — paying for capacity you don’t use. Over 80% means you’re running hot with little headroom for traffic spikes. The sweet spot is 50-80%, though critical services should run lower (more headroom) and batch workloads can run higher.
Node-level metrics matter too. Even if individual pods are well-sized, poor bin-packing can leave nodes underutilized:
# Node CPU usage percentage
100 - (avg by (node) (irate(node_cpu_seconds_total{mode="idle"}[5m])) * 100)

# Node memory usage percentage
(1 - node_memory_MemAvailable_bytes / node_memory_MemTotal_bytes) * 100Alert Rules
Dashboards are for humans browsing Grafana. Alerts are for catching problems at 3 AM. Here are the essential resource alerts:
Memory near limit catches pods about to OOM. At 90% of limit for 10 minutes, something’s wrong — either a memory leak or an undersized limit.
apiVersion: monitoring.coreos.com/v1
kind: PrometheusRule
metadata:
  name: memory-near-limit
spec:
  groups:
    - name: resource.rules
      rules:
        - alert: PodMemoryNearLimit
          expr: |
            container_memory_working_set_bytes
            / container_spec_memory_limit_bytes > 0.9
          for: 10m
          labels:
            severity: warning
          annotations:
summary: "Pod {{ $labels.pod }} at 90% memory limit"OOM kills are always worth knowing about. Even if the pod restarts successfully, repeated OOM kills indicate a sizing problem.
      - alert: PodOOMKilled
        expr: |
          increase(kube_pod_container_status_restarts_total{reason="OOMKilled"}[1h]) > 0
        labels:
          severity: critical
        annotations:
summary: "Pod {{ $labels.pod }} was OOM killed"CPU throttling above 50% for 15 minutes suggests the CPU limit is too low. Some throttling is normal for bursty workloads, but sustained throttling causes latency problems.
      - alert: CPUThrottlingHigh
        expr: |
          rate(container_cpu_cfs_throttled_periods_total[5m])
          / rate(container_cpu_cfs_periods_total[5m]) > 0.5
        for: 15m
        labels:
          severity: warning
        annotations:
summary: "Pod {{ $labels.pod }} throttled 50%+ of CPU periods"Cost Attribution
Resource efficiency directly translates to infrastructure cost. If you’re using 25% of requested resources, you’re paying for 4x what you need.
The cost model is straightforward: cloud providers charge for reserved capacity (requests), not actual usage. A namespace requesting 10 CPU cores and 20Gi memory pays the same whether it uses 100% or 10% of that capacity. The gap between requested and used is waste.
To calculate waste, multiply the efficiency gap by your hourly rates. If you’re paying $0.05 per CPU-hour and a namespace requests 10 cores but uses 2, you’re wasting $0.40 per hour — nearly $300 per month for one namespace.
| Efficiency | Interpretation | Action |
|---|---|---|
| < 20% | Severely over-requested | Reduce requests by 50% or more |
| 20-50% | Over-requested | Right-size using VPA recommendations |
| 50-80% | Well-sized | Maintain current configuration |
| > 80% | Running hot | Increase headroom for stability |
Tools like Kubecost, OpenCost, or cloud provider cost management (AWS Cost Explorer with container insights, GCP Cost Management) can automate this tracking. They break down costs by namespace, label, or team — essential for chargeback models where teams pay for their own resource consumption.
Most organizations run at 20-30% resource efficiency. Moving to 50-60% can cut infrastructure costs by 30-50%. The key is right-sizing based on actual usage, not guesses, while maintaining enough headroom for Guaranteed QoS on critical services.
Conclusion
Remember the 3 AM evictions from the introduction? The well-behaved pods died because they had requests without limits — Burstable QoS, middle of the eviction queue. The pods with no resource specs (BestEffort) should have been evicted first, but the eviction algorithm also considers usage relative to requests. The fix isn’t complicated, but it requires understanding the model.
Pod resource configuration comes down to two contracts: requests are your promise to the scheduler about what you need, and limits are your promise to the kernel about what you’ll never exceed. The scheduler uses requests to place pods; the kernel uses limits to enforce boundaries. Get these wrong and you’ll either waste money (over-requesting), starve neighbors (under-limiting), or face surprise evictions (wrong QoS class).
QoS class — Guaranteed, Burstable, or BestEffort — is derived from your resource specs, not set directly. It determines who dies first when nodes run low. If you care about a workload surviving node pressure, you need to care about its QoS class. Guaranteed (requests equal limits) for critical services, Burstable (limits greater than requests) for everything else that matters.
The operational checklist: set both requests and limits on every container. Use LimitRange to catch teams who forget. Use ResourceQuota to cap namespace consumption. Measure actual usage with Prometheus and VPA for at least two weeks before setting initial values. Review and right-size quarterly — workloads change, traffic patterns shift, and yesterday’s sizing becomes tomorrow’s waste or outage. Alert on memory near limit, OOM kills, and sustained CPU throttling.
Resources are a contract. Requests are your promise of what you need. Limits are your promise of what you’ll never exceed. QoS class is how Kubernetes prioritizes that contract when the cluster is under pressure. Write good contracts.
The goal isn’t perfect efficiency — it’s the right tradeoff between reliability and cost. Critical services get headroom. Batch jobs run lean. Everything gets measured.
Footnotes
-
cAdvisor is an open-source agent developed by Google that runs inside the kubelet. It automatically discovers all containers on a node and collects real-time resource statistics (CPU, memory, network, disk I/O) at the
/metrics/cadvisorendpoint. It has no long-term storage — Prometheus scrapes and stores the data.↩ -
kube-state-metrics (KSM) is an add-on that listens to the Kubernetes API server and generates metrics about the state of cluster objects. While cAdvisor focuses on container-level performance, KSM tracks high-level resource state: “Is this pod running?” “How many replicas are ready?” It exposes raw, unmodified data at
/metricsin Prometheus format.↩
Sharethisarticle
Enjoyed the read? Share it with your network.




