
Deep Dive
Why Your Quality Gates Are Slowing You Down
Quality gates that block too aggressively train engineers to bypass them. Here's how to design gates that catch real problems without becoming obstacles.
Learn more

Unified dashboards for metrics, logs, and traces across the observability stack
Grafana has grown from a metrics dashboard into the visualization layer for the entire observability stack. Paired with Prometheus for metrics, Loki for logs, Tempo for traces, and Mimir for long-term storage, it gives platform teams a single interface to correlate signals across infrastructure and applications. The ability to jump from a spike on a dashboard panel to the exact log lines and traces that explain it is what turns monitoring from a passive display into an active debugging tool.
For platform engineering, Grafana’s value is in standardization. Dashboard-as-code with Grafonnet or Terraform’s Grafana provider lets teams version-control their observability views alongside the infrastructure they describe. Alerting rules defined in code, provisioned through CI, and routed through Alertmanager or Grafana’s built-in contact points create a repeatable incident response foundation. SLO dashboards backed by real error budgets give service owners a shared language for reliability conversations.
The operational reality is dashboard sprawl. Without governance, every team creates bespoke dashboards that nobody else can interpret. Platform teams that invest in golden-signal dashboard templates, consistent label taxonomies, and self-service provisioning through Backstage or internal tooling get observability that scales. Those that don’t end up with hundreds of dashboards and no shared understanding of system health.
Quality gates that block too aggressively train engineers to bypass them. Here's how to design gates that catch real problems without becoming obstacles.

A data-driven framework for identifying which dashboards to keep, archive, or delete — and how to make cleanup stick.
Lead time, onboarding time, and ticket deflection metrics that show whether your platform reduces friction.

How to control tracing costs, choose the right sampling strategy, and still debug effectively.

Your gateway dashboards show healthy 200ms latency, but users report 5-second delays. The problem isn't the gateway — it's what you're measuring.

Balancing standardization with team autonomy so the right thing is easy but not the only option.

You can't manage API costs you don't measure. Here's how to build the metering and quota foundation most teams skip.

Separating platform control surfaces from runtime infrastructure for multi-team boundaries and scaling.
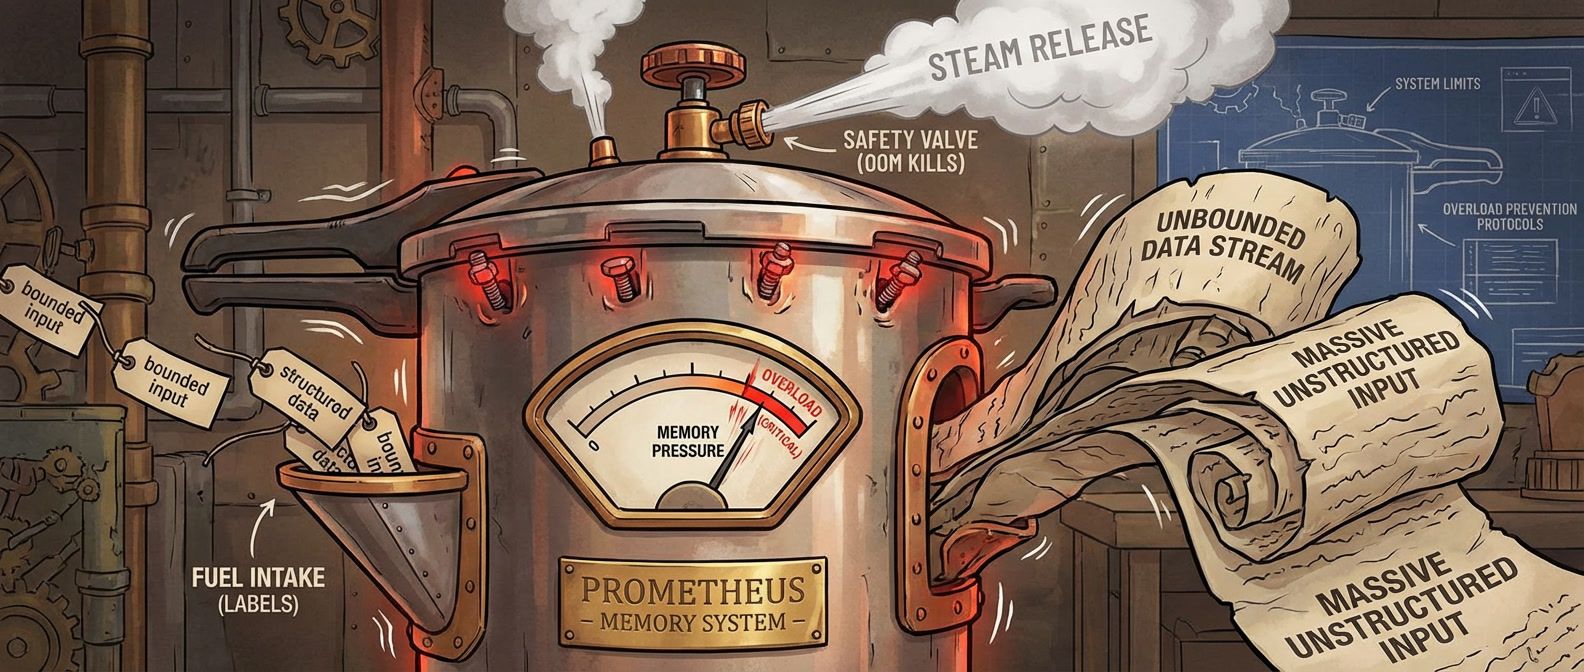
What happens when unbounded label values explode your metrics storage, and how to design around it.

Why systems that try to handle all the load end up handling none of it, and how admission control and load shedding keep services alive under pressure.

Service catalogs decay because they rely on human memory. Fix yours with ownership modeling, CI/CD enforcement, and automated drift detection.

Stop waking people up for high CPU. Learn to alert on what users actually experience — latency, errors, availability — and let SLO burn rates determine urgency.