The Prometheus Label That Ate Your Storage Budget
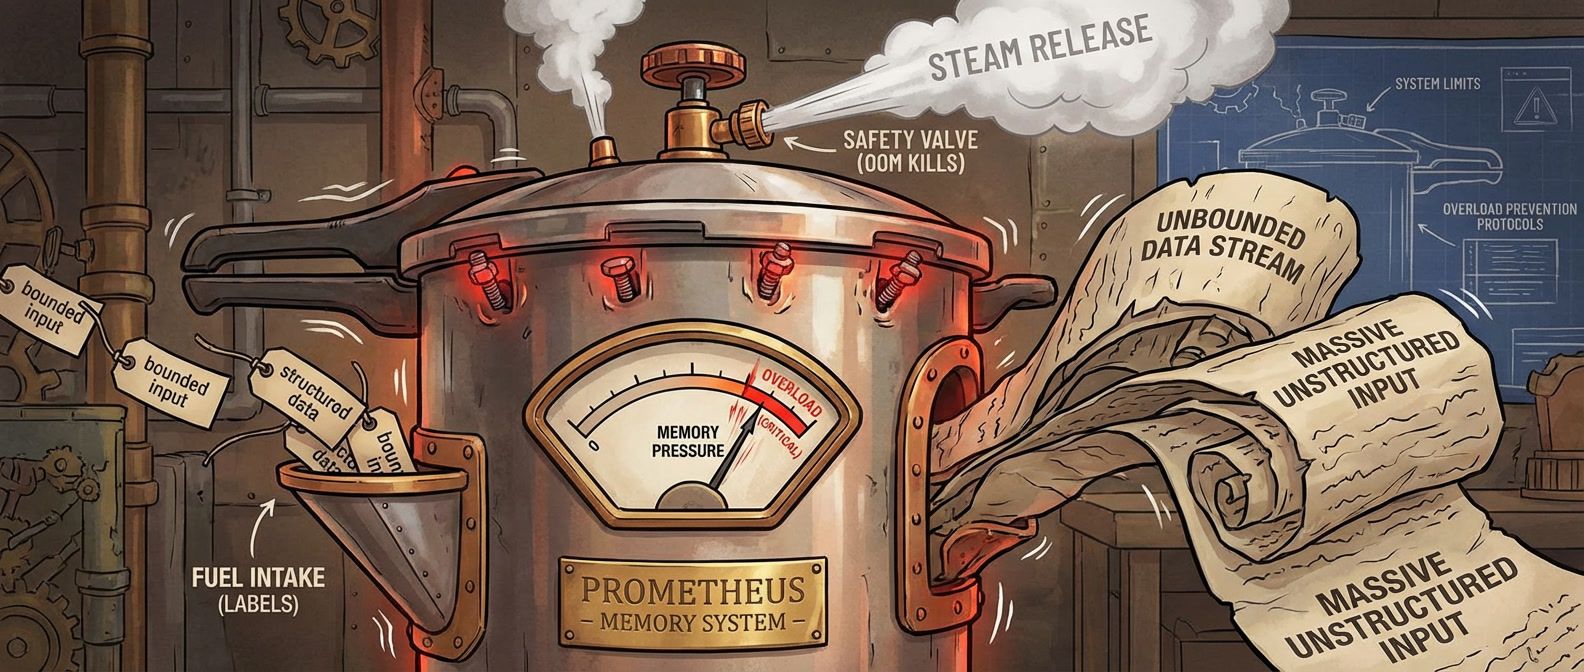
Table of Contents
Just add a label for debugging
A senior engineer during sprint planning
Those five words killed our monitoring during the worst possible moment. A team I worked with instrumented their API with response time histograms and added labels for endpoint, status code, and user_id — that last one “for debugging.” With 50 endpoints, 10 status codes, and 100,000 users, they’d created 50 million potential time series.
Initially, only active users generated metrics. Maybe 10,000 series. Prometheus hummed along. Over months, more users became active. Memory usage crept up until a marketing campaign drove a traffic spike. Memory jumped. Prometheus OOM‘d. Monitoring went dark during the incident they needed to debug.
A single unbounded label can destroy your Prometheus deployment. User IDs, request IDs, email addresses, IP addresses — any label that grows with your data will eventually exhaust memory. Design labels for known, bounded sets of values.
The Math That Kills Your Prometheus
Every unique combination of metric name and label values creates a separate time series. Labels don’t add — they multiply.
Consider a basic HTTP metrics setup: 5 HTTP methods × 20 endpoints × 10 status codes = 1,000 series. Manageable. Add a user_id label with 100,000 possible values? Now you’re looking at 10 billion potential series. The following table shows how quickly labels multiply:
| Design | Labels | Values per Label | Total Series | Approx. Memory |
|---|---|---|---|---|
| Minimal | method, handler, status_class | 5 × 20 × 4 | 400 | ~4 MB |
| Reasonable | + environment, region | × 3 × 4 | 4,800 | ~48 MB |
| Dangerous | + user_id | × 100,000 | 480,000,000 | ~4.8 TB[^1] |
Histograms make this worse. A histogram with 10 buckets creates 12 series per unique label combination (10 bucket series plus _sum and _count). That “reasonable” 4,800-series design becomes 57,600 series when you switch from a counter to a histogram.
What most people miss: Prometheus keeps metadata for all active series in memory, not just samples. A series that received one sample in the last two hours consumes nearly as much memory as one with thousands of samples. The cardinality cost is the series count, not the sample count. A rough formula: each active series consumes 1-3 KB. A Prometheus instance with 16 GB of RAM can safely handle around 2 million active series. Push past that, and you’re gambling on OOM during traffic spikes.
Good Labels vs Bad Labels
The difference between a good label and a bad one comes down to one question: can you enumerate all possible values before deployment?
If you can list them exhaustively, it’s probably safe. If the value set grows with your data — users, requests, sessions — it’s toxic.
| # | Label | Values | Cardinality | Why It Works |
|---|---|---|---|---|
| 1 | http_method | GET, POST, PUT, DELETE, PATCH | ~7 | Fixed set defined by HTTP spec |
| 2 | environment | production, staging, development | 3 | You control how many environments exist |
| 3 | status_class | 2xx, 3xx, 4xx, 5xx | 4 | Bucketed from individual codes |
| 4 | region | us-east-1, us-west-2, eu-west-1 | ~10 | Bounded by your infrastructure footprint |
| 5 | service | api, worker, scheduler | ~20 | You control how many services you deploy |
Bad labels grow without bound:
| # | Label | Problem | Cardinality | Alternative |
|---|---|---|---|---|
| 1 | user_id | Grows with user base | Millions | Traces, logs |
| 2 | request_id | Unique per request | Infinite | Exemplars |
| 3 | client_ip | Huge address space | Billions | Log analysis |
| 4 | error_message | Free-form strings | Unbounded | Error codes (bucketed) |
| 5 | Unique per user, PII risk | Millions | Don't store in metrics |
The decision framework is straightforward. First, ask: is the value set bounded and known? If no, stop — use traces or logs instead. Second: will you aggregate by this label? If no, you’re adding cardinality without value. Third: is it useful for alerting or SLOs? If it passes all three checks, it’s a good label.
Normalization: The Key Technique
The practical solution is normalization: transforming dynamic, unbounded values into bounded categories before they become label values.
Take request paths. Your API serves /api/users/123, /api/users/456, and so on — thousands of unique paths. If you use the raw path as a label, you’ve created thousands of series. Instead, normalize paths to route patterns: /api/users/123 becomes /api/users/:id. Now you have one series per route, not one per user.
The same applies to HTTP status codes. Individual codes (200, 201, 400, 401, 404, 500…) create more series than you need for most dashboards. Bucketing into status classes (2xx, 3xx, 4xx, 5xx) gives you error-rate visibility while keeping cardinality to four values. Most dashboards show “error rate” (4xx + 5xx) anyway — if you’re aggregating to classes at query time, skip the cardinality cost and bucket at the source.
But what if you genuinely need high-cardinality context for debugging? That’s where exemplars come in. An exemplar attaches a trace ID to a metric sample without creating a new time series. The metric aggregates normally for dashboards and alerts, but you can click through to the specific trace when investigating. It’s the high-cardinality context you wanted, without the cardinality cost.
If you need per-user or per-request visibility, use traces. Prometheus metrics are for aggregate views. Traces are for individual request debugging. Don’t try to make metrics do what traces do — you’ll just break your metrics.
Even with careful label design, cardinality problems can still emerge in production — a new exporter, an inherited codebase, or a third-party integration you don’t control. Here’s how to respond.
When Things Go Wrong
When Prometheus starts OOMing or queries grind to a halt, you’re in incident response mode. The goal shifts from “understand the problem” to “restore monitoring as fast as possible.”
The symptoms are usually obvious: Prometheus restarts repeatedly (OOM killed), memory usage spikes toward limits, queries timeout or return errors, scrape success rates drop. If you’re seeing any of these, assume cardinality until proven otherwise.
First priority: get Prometheus running again, even if degraded. Restart the pod to clear the head block and start fresh. If it immediately OOMs again, temporarily increase memory limits — you need monitoring back online before you can diagnose anything.
#!/bin/bash

# Restart Prometheus (clears head block, gives temporary breathing room)
kubectl rollout restart deployment/prometheus -n monitoring

# If it keeps OOMing, temporarily increase memory limits
kubectl set resources deployment/prometheus -n monitoring \
  --limits=memory=16Gi

# Check if it's staying up
kubectl get pods -n monitoring -wSecond: find what’s eating your cardinality. Once stable enough to query, find the culprit:
# Top 10 metrics by series count
topk(10, count by (__name__) ({__name__=~".+"}))

# Series created in the last hour (shows where growth is coming from)
increase(prometheus_tsdb_head_series_created_total[1h])In most cardinality explosions, one or two metrics dominate — fixing those gives you most of your headroom back. Correlate what you find with recent deployments: what went out in the last 24 – 48 hours?
Third: stop the bleeding. Once you’ve identified the problematic metric or label, stop ingesting it via metric_relabel_configs. This takes effect on config reload — no restart required:
# Add under the affected job_name in scrape_configs
metric_relabel_configs:
  - source_labels: [__name__]
    regex: 'problematic_metric_name'
    action: drop
  - regex: 'user_id|request_id'
action: labeldropDuring a cardinality crisis, your first priority is restoring monitoring, not fixing root cause. Drop the problematic metric via relabeling immediately, then investigate. You can always re-enable it after the fix is in place.
After stability returns, conduct a proper root cause analysis. Which metric exploded? Which label was unbounded? When was it introduced? Why wasn’t it caught before production? Then implement prevention: cardinality review in PRs, alerts on series count growth, and emergency configs ready to deploy.
High-Cardinality Metrics: Prometheus Label Horror
What happens when unbounded label values explode your metrics storage, and how to design around it.
What you'll get:
- Cardinality risk review checklist
- Safe label design patterns
- Series growth alert rules
- OOM incident response runbook

The Bottom Line
Every label you add must answer two questions: what bounded set of values will this have, and what aggregation does it enable? If you can’t answer both, don’t add the label.
I’ve never seen a cardinality incident that wasn’t preventable. The unbounded label was always obvious in hindsight. The teams that avoid these incidents aren’t smarter — they just have better guardrails.
Don’t wait for the 3 AM page. Audit your metrics now. Find the labels that grow with your data. Fix them before they fix you.
Share this article
Enjoyed the read? Share it with your network.