
Deep Dive
Why Your Traces Are Unreadable: Span Design
Balancing trace granularity against overhead, storage, and the ability to actually read trace waterfalls.
Learn more
Tracing, metrics, structured logging, and turning telemetry into actionable insight
Observability is the difference between knowing a system is broken and understanding why. Metrics tell you something is wrong; traces show you where the latency hides; logs give you the context to debug. But telemetry alone is not observability. The real work is designing signals that surface problems before users notice, building dashboards that get looked at, and tuning alerts that wake people up for the right reasons.
This category covers the practical side of observability engineering. Metrics cardinality sounds like a minor concern until a label with unbounded values brings your monitoring stack to its knees. Distributed tracing promises end-to-end visibility, but 100% sampling is expensive and usually unnecessary. Structured logging requires discipline to maintain consistency across services. Alert fatigue is a cultural problem as much as a technical one. These articles dig into the tradeoffs and failure modes that documentation rarely addresses.
Whether you are instrumenting a new service, trying to reduce noise in your alerting pipeline, auditing dashboards that nobody looks at, or debugging a latency spike with incomplete traces, the content here reflects hands-on experience with the unglamorous work of making systems understandable.
Balancing trace granularity against overhead, storage, and the ability to actually read trace waterfalls.

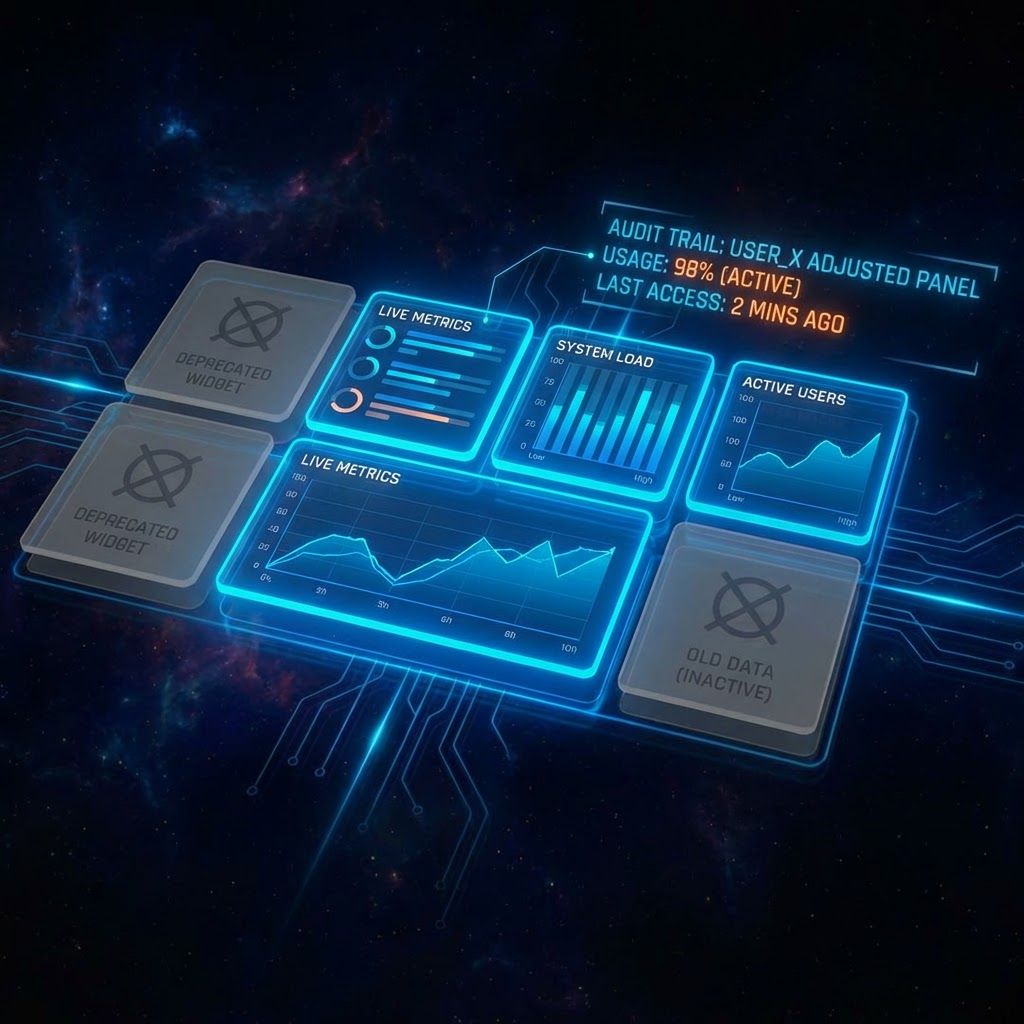
A data-driven framework for identifying which dashboards to keep, archive, or delete — and how to make cleanup stick.

How to control tracing costs, choose the right sampling strategy, and still debug effectively.
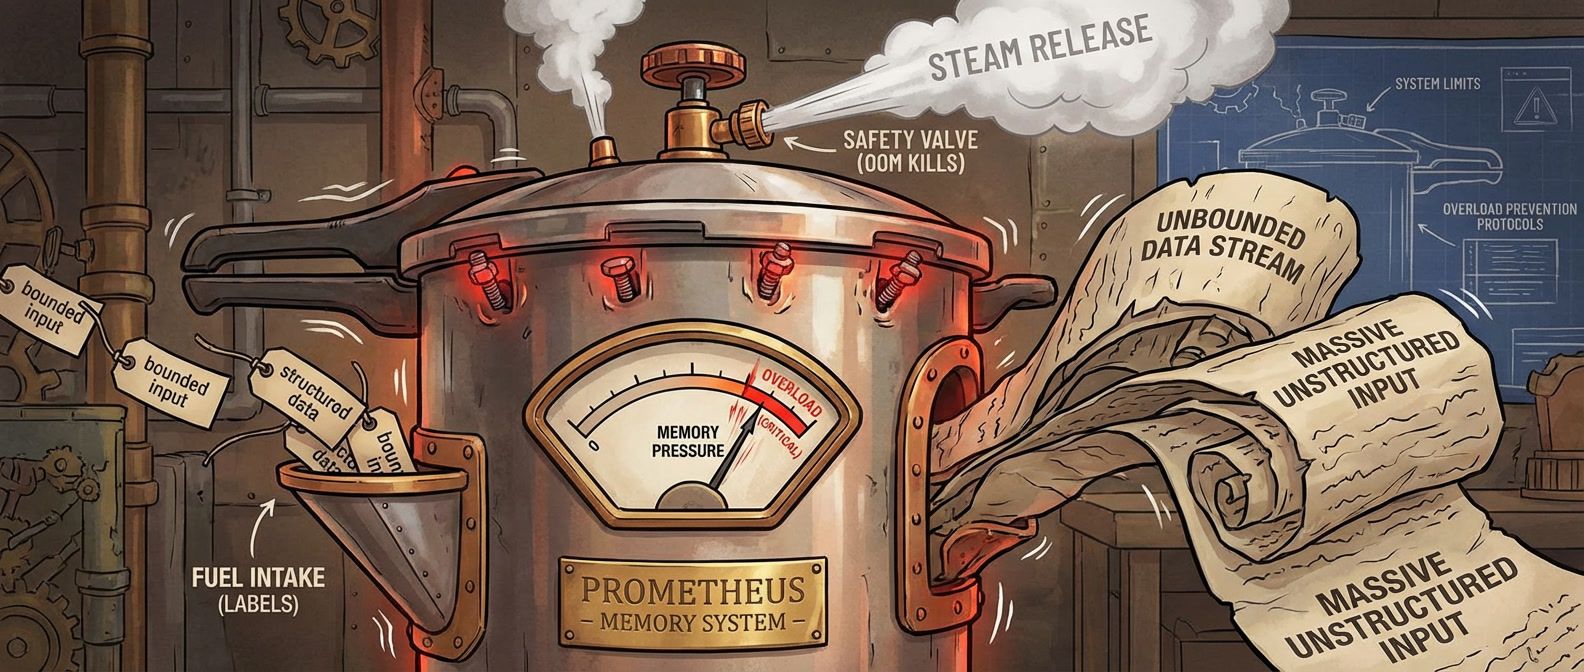
What happens when unbounded label values explode your metrics storage, and how to design around it.

How consistent log schemas and correlation IDs transform debugging from multi-service guesswork into single-query answers.

Stop waking people up for high CPU. Learn to alert on what users actually experience — latency, errors, availability — and let SLO burn rates determine urgency.