
Kubernetes Cost Drivers: What Moves the Bill

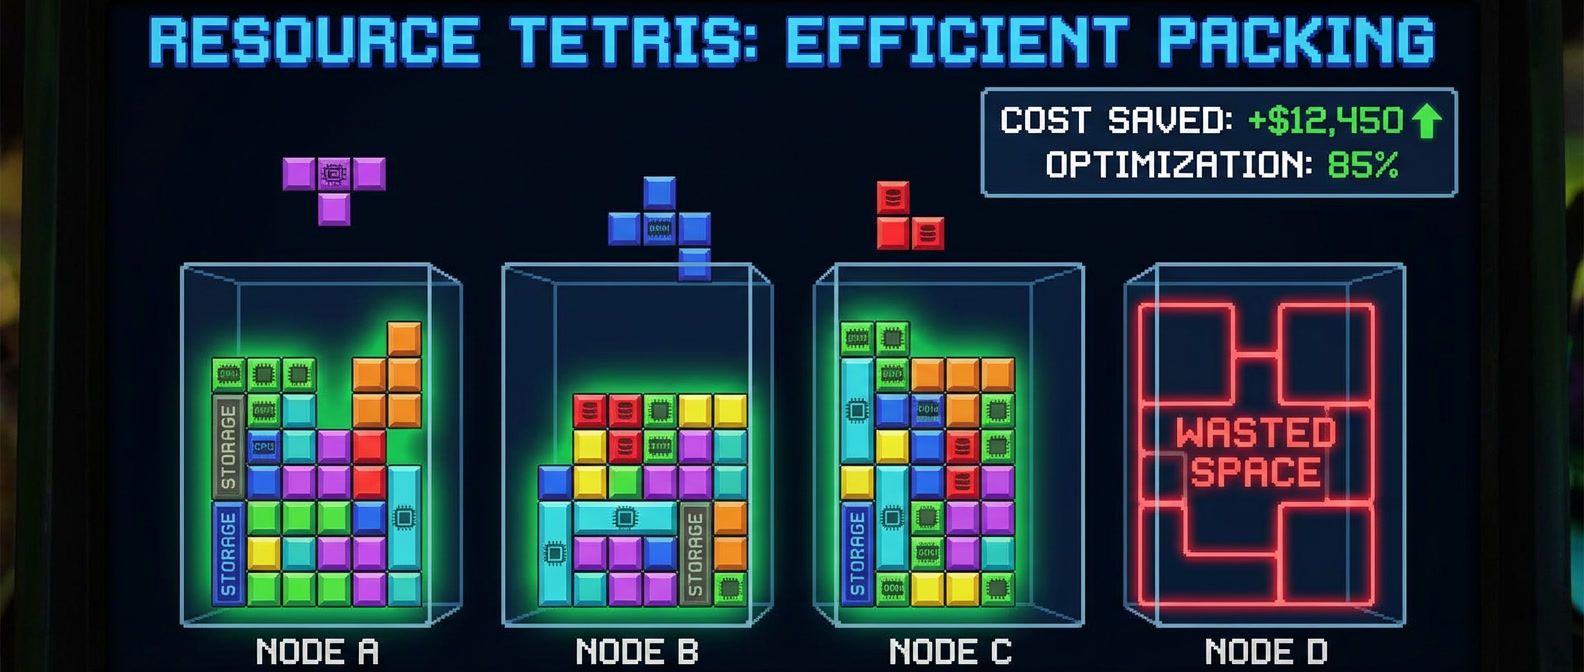
Table of Contents
Compute is typically 60-80% of Kubernetes spend, yet most teams have no visibility into whether their resource requests match actual usage. The default behavior - developers requesting “enough” resources with generous padding - leads to clusters running at 20-30% utilization while paying for 100%.
I worked with a team running 50 nodes who’d never looked at their actual resource utilization. When we finally checked, average CPU usage was 15% and memory was 25%. Resource requests were 3-4x what workloads actually used. Right-sizing those requests and enabling the cluster autoscaler dropped them to 20 nodes - a 60% cost reduction with zero performance impact. The workloads didn’t notice because they were never using the resources they’d requested.
Kubernetes cost optimization has three levers: use cheaper compute (spot instances), use less compute (right-sizing), and use compute more efficiently (bin packing). Most savings come from the boring work of accurate resource requests, not clever architecture.
Cost optimization isn’t about penny-pinching. It’s about eliminating waste that funds nothing. The savings can fund actual improvements: better observability, more environments, faster CI runners, or simply budget for the next project.
Understanding Kubernetes Resource Model
Requests vs Limits
The Kubernetes resource model trips up a lot of teams because requests and limits sound similar but do completely different things.
Requests are what the scheduler uses for placement decisions. When you set cpu: 500m as a request, you’re telling Kubernetes “this container needs half a CPU core guaranteed.” The scheduler won’t place your pod on a node unless that capacity is available. Requests are promises - the node reserves that capacity for your container whether you use it or not.
Limits are enforcement boundaries. CPU limits throttle - if your container tries to use more than its limit, it gets slowed down but keeps running. Memory limits kill - exceed your memory limit and the kernel OOM-kills your container. Limits can exceed what’s actually available on a node (overcommit), but requests cannot.
This distinction matters for cost because requests determine how many nodes you need. If every pod requests 1 CPU but only uses 0.1, you’re paying for 10x the capacity you need. The scheduler sees the cluster as full when it’s actually 90% idle.
Kubernetes assigns a QoS class based on how you set resources. Guaranteed pods (requests equal limits for all resources) get the highest priority and are evicted last under pressure. Burstable pods (requests less than limits) are the common case. BestEffort pods (no requests or limits) are evicted first - avoid these in production. To control your pod’s QoS class, set both CPU and memory requests equal to their limits for Guaranteed, or set requests lower than limits (or omit limits) for Burstable.
| Aspect | Request | Limit |
|---|---|---|
| Scheduling | Used for placement decisions | Not considered |
| CPU behavior | Guaranteed minimum | Throttled if exceeded |
| Memory behavior | Guaranteed minimum | OOM killed if exceeded |
| Cluster capacity | Sum of requests = schedulable capacity | Sum of limits can exceed node capacity |
| Cost impact | Directly determines node count | Indirectly affects density |
Setting requests too high wastes money (nodes appear full but aren’t). Setting requests too low causes scheduling failures (pods can’t find nodes) or performance issues (resource contention). The goal is requests that match actual usage with a small buffer.
A side note on memory limits: there’s an ongoing debate about whether to set them at all. OOM kills are often worse than letting the system handle memory pressure through other mechanisms. Some teams omit memory limits entirely and rely on requests for scheduling - a valid approach that deserves its own discussion.
The Over-Provisioning Problem
Understanding the request/limit distinction explains why over-provisioning is so expensive - but it doesn’t explain why it’s so common.
Over-provisioning happens organically. A developer sets resource requests during initial deployment, picks numbers that seem reasonable with some safety margin, and never revisits them. The service works fine, so the requests stay. Multiply this across hundreds of services and you end up with a cluster that’s 30% utilized but “full” according to the scheduler.
The math is straightforward but the numbers are often shocking. If you request 1 CPU and use 0.2 on average, your efficiency is 20%. That container is blocking 0.8 CPUs from being used by anything else. Across a cluster, these inefficiencies compound.
I calculate waste using the 99th percentile of actual usage plus a 20% buffer. If a container’s P99 CPU usage is 200m, a reasonable request is 240m. If the current request is 1000m, you’re wasting 760m on that single container. Find the 20 worst offenders in your cluster and you’ll typically find 40-60% of your total waste.
The fix isn’t complicated - it’s just tedious. You need historical usage data, you need to identify what’s over-provisioned, and you need to update the requests. The Vertical Pod Autoscaler can help automate this, which we’ll cover in the next section.
Right-Sizing Resources
Prometheus Queries for Usage Analysis
Right-sizing requires historical usage data. You need to know what containers actually use, not what developers guessed they’d need. If you’re running Prometheus with kube-state-metrics (and you should be), you already have everything you need.
The key metrics are P95 or P99 usage over a meaningful time window - at least 7 days to capture weekly patterns, ideally 30 days for workloads with monthly cycles. Average usage tells you what’s typical, but peak usage tells you what you need to handle without degradation.
# P99 CPU usage over 7 days (millicores)
quantile_over_time(0.99,
  rate(container_cpu_usage_seconds_total{
    container!="",
    container!="POD"
  }[5m])[7d:1h]
) * 1000

# P99 memory usage over 7 days
quantile_over_time(0.99,
  container_memory_working_set_bytes{
    container!="",
    container!="POD"
  }[7d:1h]
)

# CPU efficiency ratio (usage / request)
sum by (namespace, pod, container) (
  rate(container_cpu_usage_seconds_total{container!=""}[5m])
)
/
sum by (namespace, pod, container) (
  kube_pod_container_resource_requests{resource="cpu"}
)The efficiency ratio is particularly useful for finding waste at a glance. A ratio of 0.2 means the container uses 20% of what it requests - the other 80% is blocked capacity that nothing else can use.
Vertical Pod Autoscaler
The Vertical Pod Autoscaler watches container resource usage and recommends (or automatically applies) right-sized requests. I recommend starting in “Off” mode, which gives you recommendations without automatic changes.
# VPA in recommendation-only mode
apiVersion: autoscaling.k8s.io/v1
kind: VerticalPodAutoscaler
metadata:
  name: api-server-vpa
  namespace: production
spec:
  targetRef:
    apiVersion: apps/v1
    kind: Deployment
    name: api-server
  updatePolicy:
    updateMode: "Off"  # Recommendations only, no automatic changes
  resourcePolicy:
    containerPolicies:
      - containerName: api
        minAllowed:
          cpu: "100m"
          memory: "128Mi"
        maxAllowed:
          cpu: "4"
memory: "8Gi"After deploying the VPA, wait 24-48 hours for it to collect enough data, then check its recommendations with kubectl describe vpa api-server-vpa. The output shows a target recommendation (what VPA suggests), plus lower and upper bounds that account for variance. The target is typically safe to apply directly.
The workflow I use: deploy VPAs in recommendation mode for all deployments, review recommendations weekly, apply changes through the normal deployment process (not via VPA auto-apply), and validate that workloads remain healthy after the change. This keeps humans in the loop while still automating the analysis.
Start VPA in “Off” mode to get recommendations without automatic changes. Review recommendations weekly, apply them through your normal deployment process, and validate that workloads remain healthy. Automatic modes work but remove the human verification step.
VPA has other update modes - “Initial” applies recommendations only when pods are created, and “Recreate” evicts pods to apply new resource values. These work, but they remove the verification step. For production workloads, I prefer explicit control over when resource changes roll out.
Spot and Preemptible Instances
Spot Instance Fundamentals
Spot instances are spare cloud capacity sold at steep discounts - typically 50-90% off on-demand pricing. The catch: they can be reclaimed with short notice when the cloud provider needs that capacity back. AWS gives you a 2-minute warning, GCP and Azure give you 30 seconds.
Every cloud provider has their own name for this: AWS calls them Spot Instances, GCP has Preemptible VMs and Spot VMs, Azure has Spot VMs. The mechanics differ slightly but the concept is the same: cheaper compute that might disappear.
Spot works well for stateless workloads (web servers, API servers, workers), batch processing (data pipelines, ML training), development environments, and CI/CD runners. It’s a poor fit for databases, stateful services without replication, long-running jobs that can’t checkpoint, and single-replica critical services. The rule of thumb: if your workload can survive losing a node at any moment, it’s a spot candidate.
How often do interruptions happen? It varies by instance type and region, but in my experience, a diversified spot pool sees 1-3 interruptions per week. Popular instance types in busy regions get interrupted more frequently. The savings still outweigh the operational overhead for suitable workloads - you just need to design for it.
Node Pool Configuration
The typical pattern is multiple node pools: on-demand for critical workloads, spot for everything else. Taints prevent pods from accidentally landing on the wrong pool - spot nodes have a taint that only spot-tolerant workloads can schedule on.
# eksctl cluster config with mixed node pools
apiVersion: eksctl.io/v1alpha5
kind: ClusterConfig
metadata:
  name: production-cluster
  region: us-west-2

managedNodeGroups:
  # On-demand pool for critical workloads
  - name: on-demand-critical
    instanceTypes: ["m5.xlarge", "m5a.xlarge"]
    desiredCapacity: 3
    minSize: 3
    maxSize: 10
    labels:
      node-type: on-demand
    taints:
      - key: workload-type
        value: critical
        effect: NoSchedule

  # Spot pool for general workloads
  - name: spot-general
    instanceTypes: ["m5.xlarge", "m5a.xlarge", "m5n.xlarge", "m6i.xlarge"]
    spot: true
    desiredCapacity: 5
    minSize: 0
    maxSize: 50
    labels:
      node-type: spot
    taints:
      - key: node-type
        value: spot
effect: NoScheduleNotice the spot pool specifies multiple instance types. This is critical - if you only request one instance type, you’re competing with everyone else who wants that exact type, and you’ll see more interruptions. Diversifying across similar instance types (same vCPU and memory, different generations or processor families) dramatically improves availability.
Workload Configuration for Spot
A workload needs three things to run safely on spot: multiple replicas spread across availability zones, tolerations for the spot taint, and graceful shutdown handling to drain cleanly when interrupted.
# Deployment configured for spot instances
apiVersion: apps/v1
kind: Deployment
metadata:
  name: api-server
spec:
  replicas: 5
  template:
    spec:
      # Spread across zones for spot diversification
      topologySpreadConstraints:
        - maxSkew: 1
          topologyKey: topology.kubernetes.io/zone
          whenUnsatisfied: ScheduleAnyway
          labelSelector:
            matchLabels:
              app: api-server

      # Tolerate spot taint
      tolerations:
        - key: node-type
          value: spot
          effect: NoSchedule

      # Prefer spot but allow on-demand as fallback
      affinity:
        nodeAffinity:
          preferredDuringSchedulingIgnoredDuringExecution:
            - weight: 100
              preference:
                matchExpressions:
                  - key: node-type
                    operator: In
                    values: ["spot"]

      terminationGracePeriodSeconds: 30
      containers:
        - name: api
          lifecycle:
            preStop:
              exec:
command: ["/bin/sh", "-c", "sleep 5"]The preStop hook gives in-flight requests time to complete before the container shuts down. Combined with a Pod Disruption Budget that maintains minimum availability, the workload can handle spot interruptions without dropping requests.
The key to spot success is redundancy: multiple replicas, spread across availability zones, with graceful shutdown handling. A workload that survives losing 1-2 nodes at any time handles spot interruptions naturally.
Node Termination Handler
When a spot instance is about to be reclaimed, something needs to cordon the node (stop new pods from scheduling) and drain existing pods (gracefully evict them to other nodes). The node termination handler does this automatically.
On AWS, deploy the aws-node-termination-handler as a DaemonSet on spot nodes. It monitors the instance metadata service for interruption warnings and triggers a drain when one arrives. GKE has built-in handling. AKS requires a separate node drain handler.
| Provider | Warning Time | Detection Method | Handler |
|---|---|---|---|
| AWS | 2 minutes | IMDS + EventBridge | aws-node-termination-handler |
| GCP | 30 seconds | Metadata server | Built-in GKE handling |
| Azure | 30 seconds | Scheduled Events API | Node drain handler |
The 2-minute warning on AWS is usually enough to drain most pods, especially if they have short termination grace periods. GCP’s 30-second warning is tighter - workloads need to shut down fast. If your pods take longer than the warning window to drain, they’ll be killed ungracefully.
To verify your termination handler is working, check that it’s running on all spot nodes (kubectl get pods -n kube-system -l app=aws-node-termination-handler), then test by manually terminating a spot instance and watching the drain behavior. Common issues: the handler not having permissions to cordon/drain nodes, or pods with terminationGracePeriodSeconds longer than the warning window.
Cost Visibility and Allocation
Cost Allocation by Namespace
You can’t optimize costs without knowing who’s spending what. The foundation is consistent labeling - every namespace and workload should have labels that map to a cost center, team, environment, and service name. Without these, you’re stuck with cluster-wide numbers that nobody owns.
I use four required labels: cost-center (which business unit pays), environment (production, staging, dev), service (the application name), and team (who’s responsible). Optional labels like project or temporary help with more granular tracking. The key is consistency - pick a schema and enforce it.
ResourceQuotas give teams budgets they can’t exceed. A quota of 50 CPU cores and 100Gi memory for a namespace creates a hard ceiling. LimitRanges set defaults so pods without explicit resources get reasonable values instead of unlimited access.
# Namespace with cost allocation labels and quota
apiVersion: v1
kind: Namespace
metadata:
  name: payments-production
  labels:
    cost-center: engineering
    environment: production
    team: payments
---
apiVersion: v1
kind: ResourceQuota
metadata:
  name: compute-quota
  namespace: payments-production
spec:
  hard:
    requests.cpu: "50"
    requests.memory: "100Gi"
pods: "200"Cost Monitoring Dashboard
The most impactful cost dashboard shows teams their waste, not their spend. “You spent $5,000” doesn’t tell anyone what to do differently. “You’re using 30% of what you requested” does.
Build dashboards around efficiency ratios and wasted resources. The core queries are straightforward:
# CPU efficiency by namespace (usage / requests)
sum by (namespace) (rate(container_cpu_usage_seconds_total{container!=""}[5m]))
/
sum by (namespace) (kube_pod_container_resource_requests{resource="cpu"})

# Wasted CPU by team label (requested - used)
sum by (label_team) (kube_pod_container_resource_requests{resource="cpu"})
-
sum by (label_team) (rate(container_cpu_usage_seconds_total{container!=""}[5m]))Set thresholds that make waste visible at a glance: under 30% efficiency gets red, 30-50% gets yellow, over 70% gets green. Sort by absolute waste so the biggest opportunities surface first.
For dollar-based cost attribution, you need to map resource usage to actual pricing. Tools like Kubecost, OpenCost, or cloud provider cost management services handle this by combining Kubernetes metrics with billing data. They’re worth the setup if you need chargeback or showback reporting. A typical output looks like: “payments namespace: $4,200/month allocated, $1,800/month used, $2,400/month wasted” - that waste number is what drives conversations.
The most impactful cost visibility is showing teams their waste, not their spend. A dashboard showing “You’re using 30% of what you requested” drives action. A dashboard showing “You spent $5,000” doesn’t tell teams what to do differently.
Cluster Autoscaler Optimization
Autoscaler Configuration
The cluster autoscaler adds nodes when pods can’t be scheduled and removes nodes when they’re underutilized. For cost optimization, you want it to scale down aggressively (remove idle capacity) and prefer cheaper node pools when scaling up.
The key scale-down settings are scale-down-utilization-threshold (nodes below this utilization are candidates for removal) and scale-down-unneeded-time (how long a node must be underutilized before removal). A threshold of 0.5 and unneeded time of 10 minutes is a reasonable starting point - aggressive enough to remove waste but not so aggressive that you’re constantly churning nodes.
The expander controls which node pool the autoscaler scales when multiple pools could satisfy pending pods. For cost optimization, use least-waste (picks the pool that results in least idle resources) or priority (lets you explicitly prefer spot pools over on-demand). The price expander sounds ideal but requires accurate cost data that’s often stale.
Priority-Based Autoscaling
The priority expander lets you define a preference order for node pools. Configure it to try spot pools first, fall back to general on-demand if spot capacity isn’t available, and use expensive on-demand pools only as a last resort.
# ConfigMap for priority-based node pool selection
# Adjust regex patterns to match your node pool naming convention
apiVersion: v1
kind: ConfigMap
metadata:
  name: cluster-autoscaler-priority-expander
  namespace: kube-system
data:
  priorities: |-
    100:
      - spot-.*              # Highest priority: spot pools
    50:
      - on-demand-general.*  # Medium: general on-demand
    10:
- on-demand-critical.* # Lowest: expensive fallbackWith this configuration, the autoscaler first tries to scale spot pools. If spot capacity isn’t available (the cloud provider is out of that instance type), it falls back to general on-demand. The critical on-demand pool only gets used when everything else fails. Add --expander=priority and --expanderConfigMap=cluster-autoscaler-priority-expander to the autoscaler command to enable it.
| # | Setting | Cost Optimization | Stability | Recommendation |
|---|---|---|---|---|
| 1 | scale-down-utilization-threshold | 0.5 (aggressive) | Lower | Start at 0.5, increase if too much churn |
| 2 | scale-down-unneeded-time | 5m (aggressive) | Lower | 10m is balanced default |
| 3 | scale-down-delay-after-add | 10m (balanced) | Higher | Prevents thrashing |
| 4 | expander | priority or least-waste | N/A | Use priority for spot preference |
Conclusion
Kubernetes cost optimization comes down to a few straightforward practices: measure what you’re actually using, right-size resources to match that usage, run stateless workloads on spot instances, and tune the autoscaler to prefer cheaper capacity.
The biggest wins come from fixing over-provisioned resources - the boring work of adjusting requests to match actual usage. Teams that invest in cost visibility and right-sizing typically reduce spend by 40-60% without any architectural changes. No new services, no migration projects, just better numbers in existing deployment manifests.
Cost optimization is continuous, not a one-time project. Usage patterns change, new services deploy with default resources, and spot savings vary. Build cost review into your regular operations - a monthly meeting that reviews efficiency dashboards and identifies right-sizing opportunities keeps savings compounding.
Start with visibility. Deploy VPA in recommendation mode across your workloads and let it collect data for a week. Query efficiency ratios to find your worst offenders - the deployments requesting 4x what they use - and fix those first. The Pareto principle applies: 20% of your workloads probably account for 80% of your waste. Once you’ve addressed the obvious outliers, build a dashboard that tracks efficiency by namespace so teams can self-service.
Then look at spot instances. Any workload that can tolerate losing a node - web servers, API servers, workers, CI runners - is a spot candidate. With proper interruption handling (multiple replicas, zone spreading, graceful shutdown), spot instances deliver 50-70% savings on compute with minimal operational overhead.
Sharethisarticle
Enjoyed the read? Share it with your network.




