
Article
Alert Fatigue: The Audit That Cut Our Noise by 80%
A practical three-step framework to audit your alerts, classify them by usefulness, and delete the noise that's hiding real incidents.
Learn more
Pull-based metrics collection, PromQL queries, and alerting for Kubernetes stacks
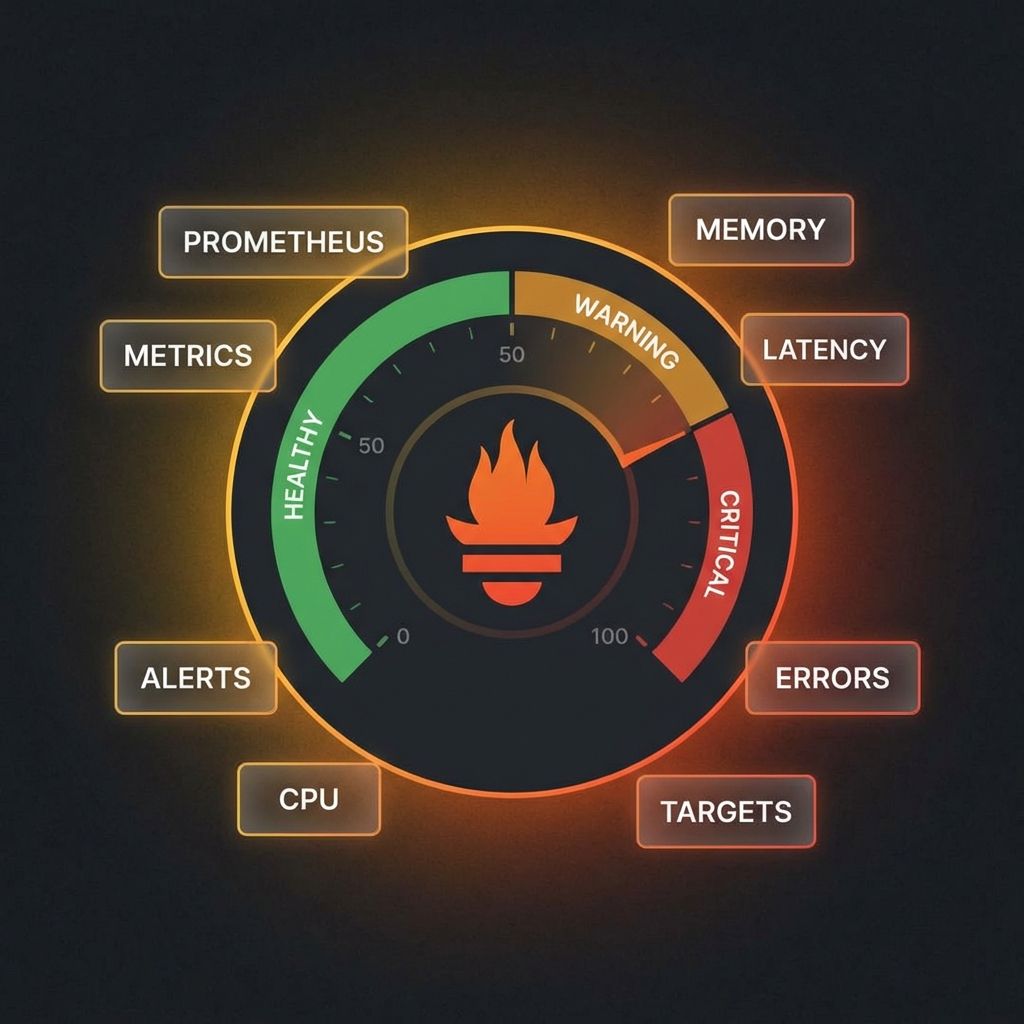
Prometheus is the metrics backbone of most Kubernetes-native observability stacks. Its pull-based scraping model, dimensional data model with labels, and powerful PromQL query language give platform teams the foundation for monitoring infrastructure health, tracking service-level objectives, and powering alerting pipelines. As a CNCF graduated project, it defines the standard that exporters, client libraries, and compatible systems like Thanos and Mimir build against.
For platform engineers, Prometheus work centers on designing a metrics architecture that scales. That means configuring ServiceMonitors and PodMonitors through the Prometheus Operator, setting up federation or remote-write for multi-cluster aggregation, and tuning retention and storage to balance query performance against disk costs. PromQL fluency is essential—writing recording rules that pre-aggregate expensive queries, defining multi-window burn-rate alerts for SLO monitoring, and building dashboards that surface actionable signals instead of vanity metrics.
The operational challenge is cardinality. Every unique combination of metric name and label values creates a time series, and unbounded labels from request paths, user IDs, or pod names can explode storage and query latency. Platform teams that enforce labeling conventions, set per-tenant series limits, and instrument cardinality dashboards keep Prometheus healthy. Those that skip cardinality governance learn about it during their next outage investigation when queries time out.
A practical three-step framework to audit your alerts, classify them by usefulness, and delete the noise that's hiding real incidents.

Certificate expiration is the leading cause of mTLS outages. Here's how to monitor, rotate, and debug certificates before they take down production.

The boring resource decisions that actually determine your cloud spend on Kubernetes clusters.

Why Horizontal Pod Autoscaler often reacts too slowly and how to tune it for your traffic patterns.
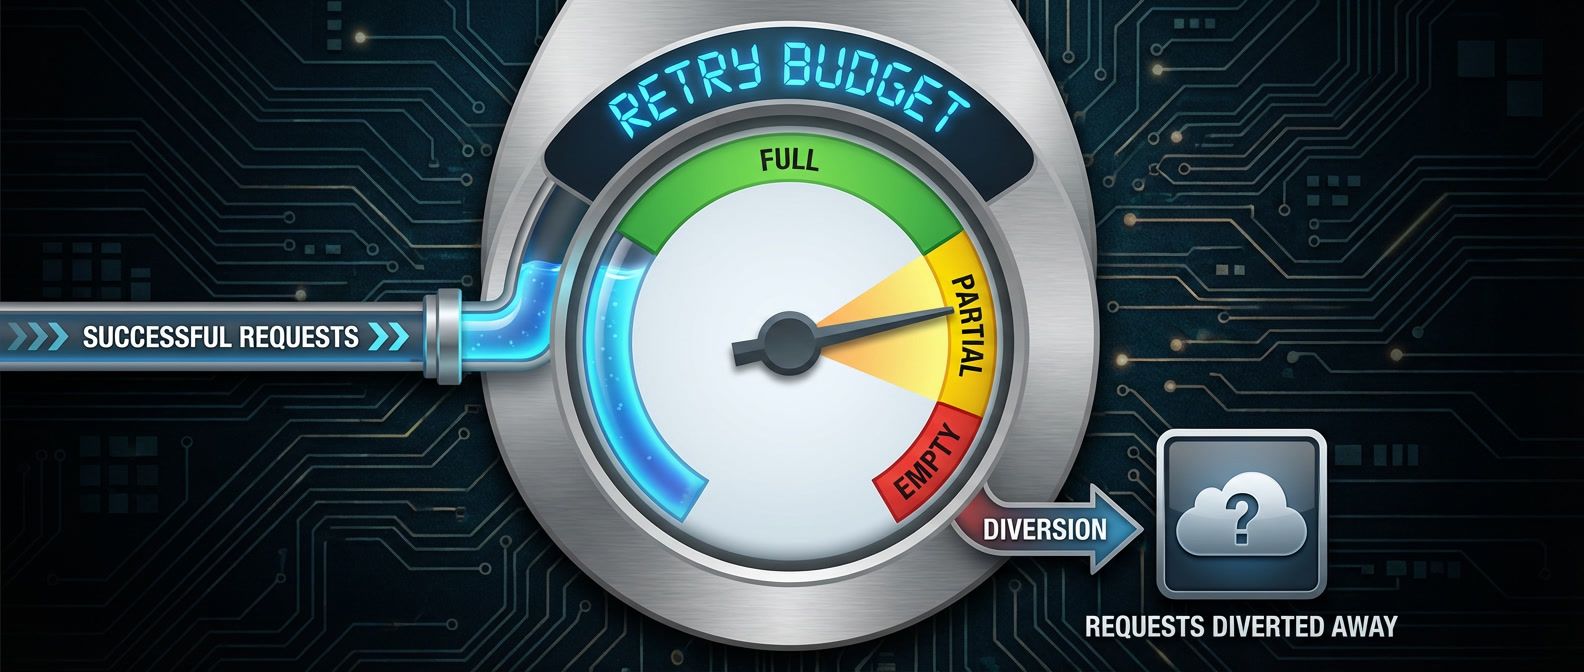
Protecting downstream services from cascade failures without hiding real problems behind open circuits.

Your gateway dashboards show healthy 200ms latency, but users report 5-second delays. The problem isn't the gateway — it's what you're measuring.

The two most common causes of mysterious 502 and 400 errors in Nginx and HAProxy, and how to tune timeouts and buffers for production traffic.

Configuring PodDisruptionBudgets to survive node rotations without blocking cluster operations.
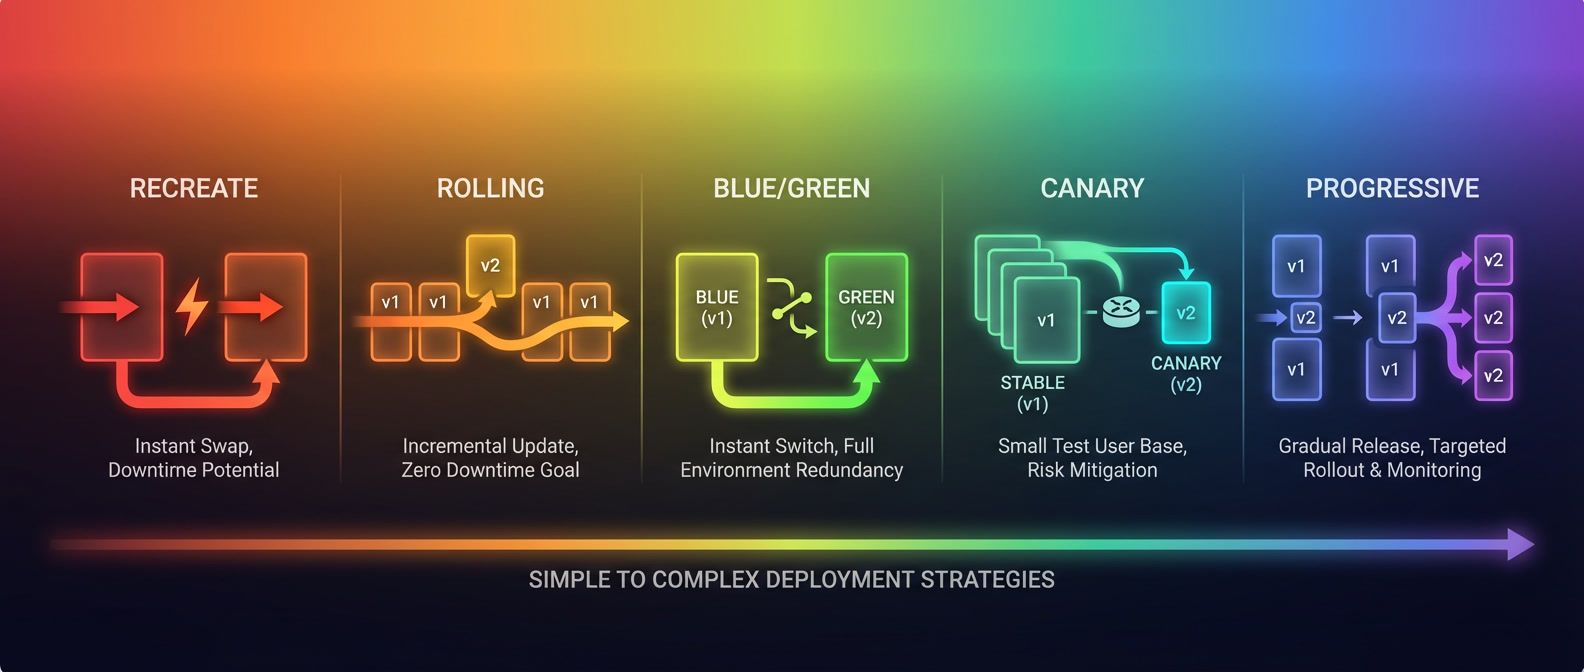
Most deployment strategy debates miss the critical constraint: your database. Learn when blue/green and canary deployments actually work — and when they'll fail spectacularly.

You can't manage API costs you don't measure. Here's how to build the metering and quota foundation most teams skip.

Learn why Helm releases drift from their desired state, how to detect drift before it causes incidents, and what to do when rollbacks fail unexpectedly.

Stop debating whether deployments are 'safe enough.' Error budgets convert reliability from an opinion into a number you can spend.