
Reverse Proxy Hardening: Timeouts, Buffers, Defaults


Table of Contents
Nginx and HAProxy ship with defaults optimized for getting started quickly, not for handling production traffic. Default buffer sizes assume small requests. Default timeouts assume fast backends. Default connection limits assume modest traffic. When real load arrives—10,000 concurrent connections, slow clients on mobile networks, backends that occasionally take 30 seconds to respond — these defaults fail in ways that are hard to diagnose.
A 502 error from Nginx could mean a dozen different things. The backend refused the connection. The backend accepted the connection but didn’t respond in time. The backend started responding but the response was too large to buffer. The proxy ran out of file descriptors. Without understanding the proxy’s internals, you’re guessing.
Here’s a scenario I’ve seen play out. A team deploys their API behind Nginx with the default configuration. Traffic grows to 5,000 RPS. Intermittent 502 errors start appearing. The backend looks healthy — response times are fine, no errors in application logs. The problem is invisible until someone digs into Nginx’s internals. It turns out proxy_read_timeout defaults to 60 seconds, which sounds generous until you realize a few slow endpoints sometimes take 65 seconds (database queries, external API calls). Meanwhile, worker_connections is 1024, and with keep-alives holding connections open, they’re running out of connection slots during traffic spikes.
After tuning timeouts, increasing worker connections, and adjusting buffer sizes, the 502s disappear. The lesson: proxy configuration is where traffic patterns meet system limits. Production tuning isn’t optional optimization — it’s the difference between a proxy that handles traffic gracefully and one that drops connections under load.
The most dangerous proxy configuration is one that works perfectly in development. Production traffic patterns — slow clients, large payloads, connection storms — expose every untuned default.
Understanding Proxy Architecture
Request Flow Through Proxies
Every HTTP request passing through a reverse proxy goes through distinct phases, each with its own timeout and buffer settings. Understanding this flow is essential for diagnosing where failures occur.
The journey starts with the client connection phase: TCP handshake, then TLS handshake if HTTPS. This is where listen and ssl_protocols in Nginx (or bind and ssl-min-ver in HAProxy) come into play. A slow TLS handshake here — perhaps due to missing OCSP stapling or expensive cipher negotiation — adds latency before the proxy even sees the HTTP request.
Next comes request receipt: the proxy reads the request line, headers, and body. This is where client_header_timeout and client_body_timeout apply. A mobile client on a flaky connection might take 10 seconds to send a 5MB upload. If your timeout is 5 seconds, the connection drops.
The backend connection phase is often the source of 502 errors. The proxy opens a connection to the upstream server (or reuses one from a keep-alive pool). These backend connections can be TCP sockets, Unix domain sockets (for backends on the same host), or TLS-encrypted connections for backends that require encryption in transit.
In cloud deployments, the pattern varies: within a Kubernetes cluster, backends typically run on the same node or within a private network, so plain HTTP over TCP is common — TLS termination happens at the ingress, not between services. For backends in different VPCs or external services, you’ll often see TLS to the backend, which adds a TLS handshake to each new connection (another reason keep-alive pools matter). Unix sockets eliminate network overhead entirely but only work when proxy and backend share a filesystem.
The configuration parameters proxy_connect_timeout in Nginx or timeout connect in HAProxy controls how long to wait for the backend connection. If the backend is overloaded and not accepting connections, this timeout fires.
Finally, the proxy forwards the request, receives the response, and delivers it to the client. Each phase has its own timeout. The response delivery phase is particularly important for slow clients — a backend might respond in 50ms, but if the client is on a 2G connection, sending that response takes seconds.
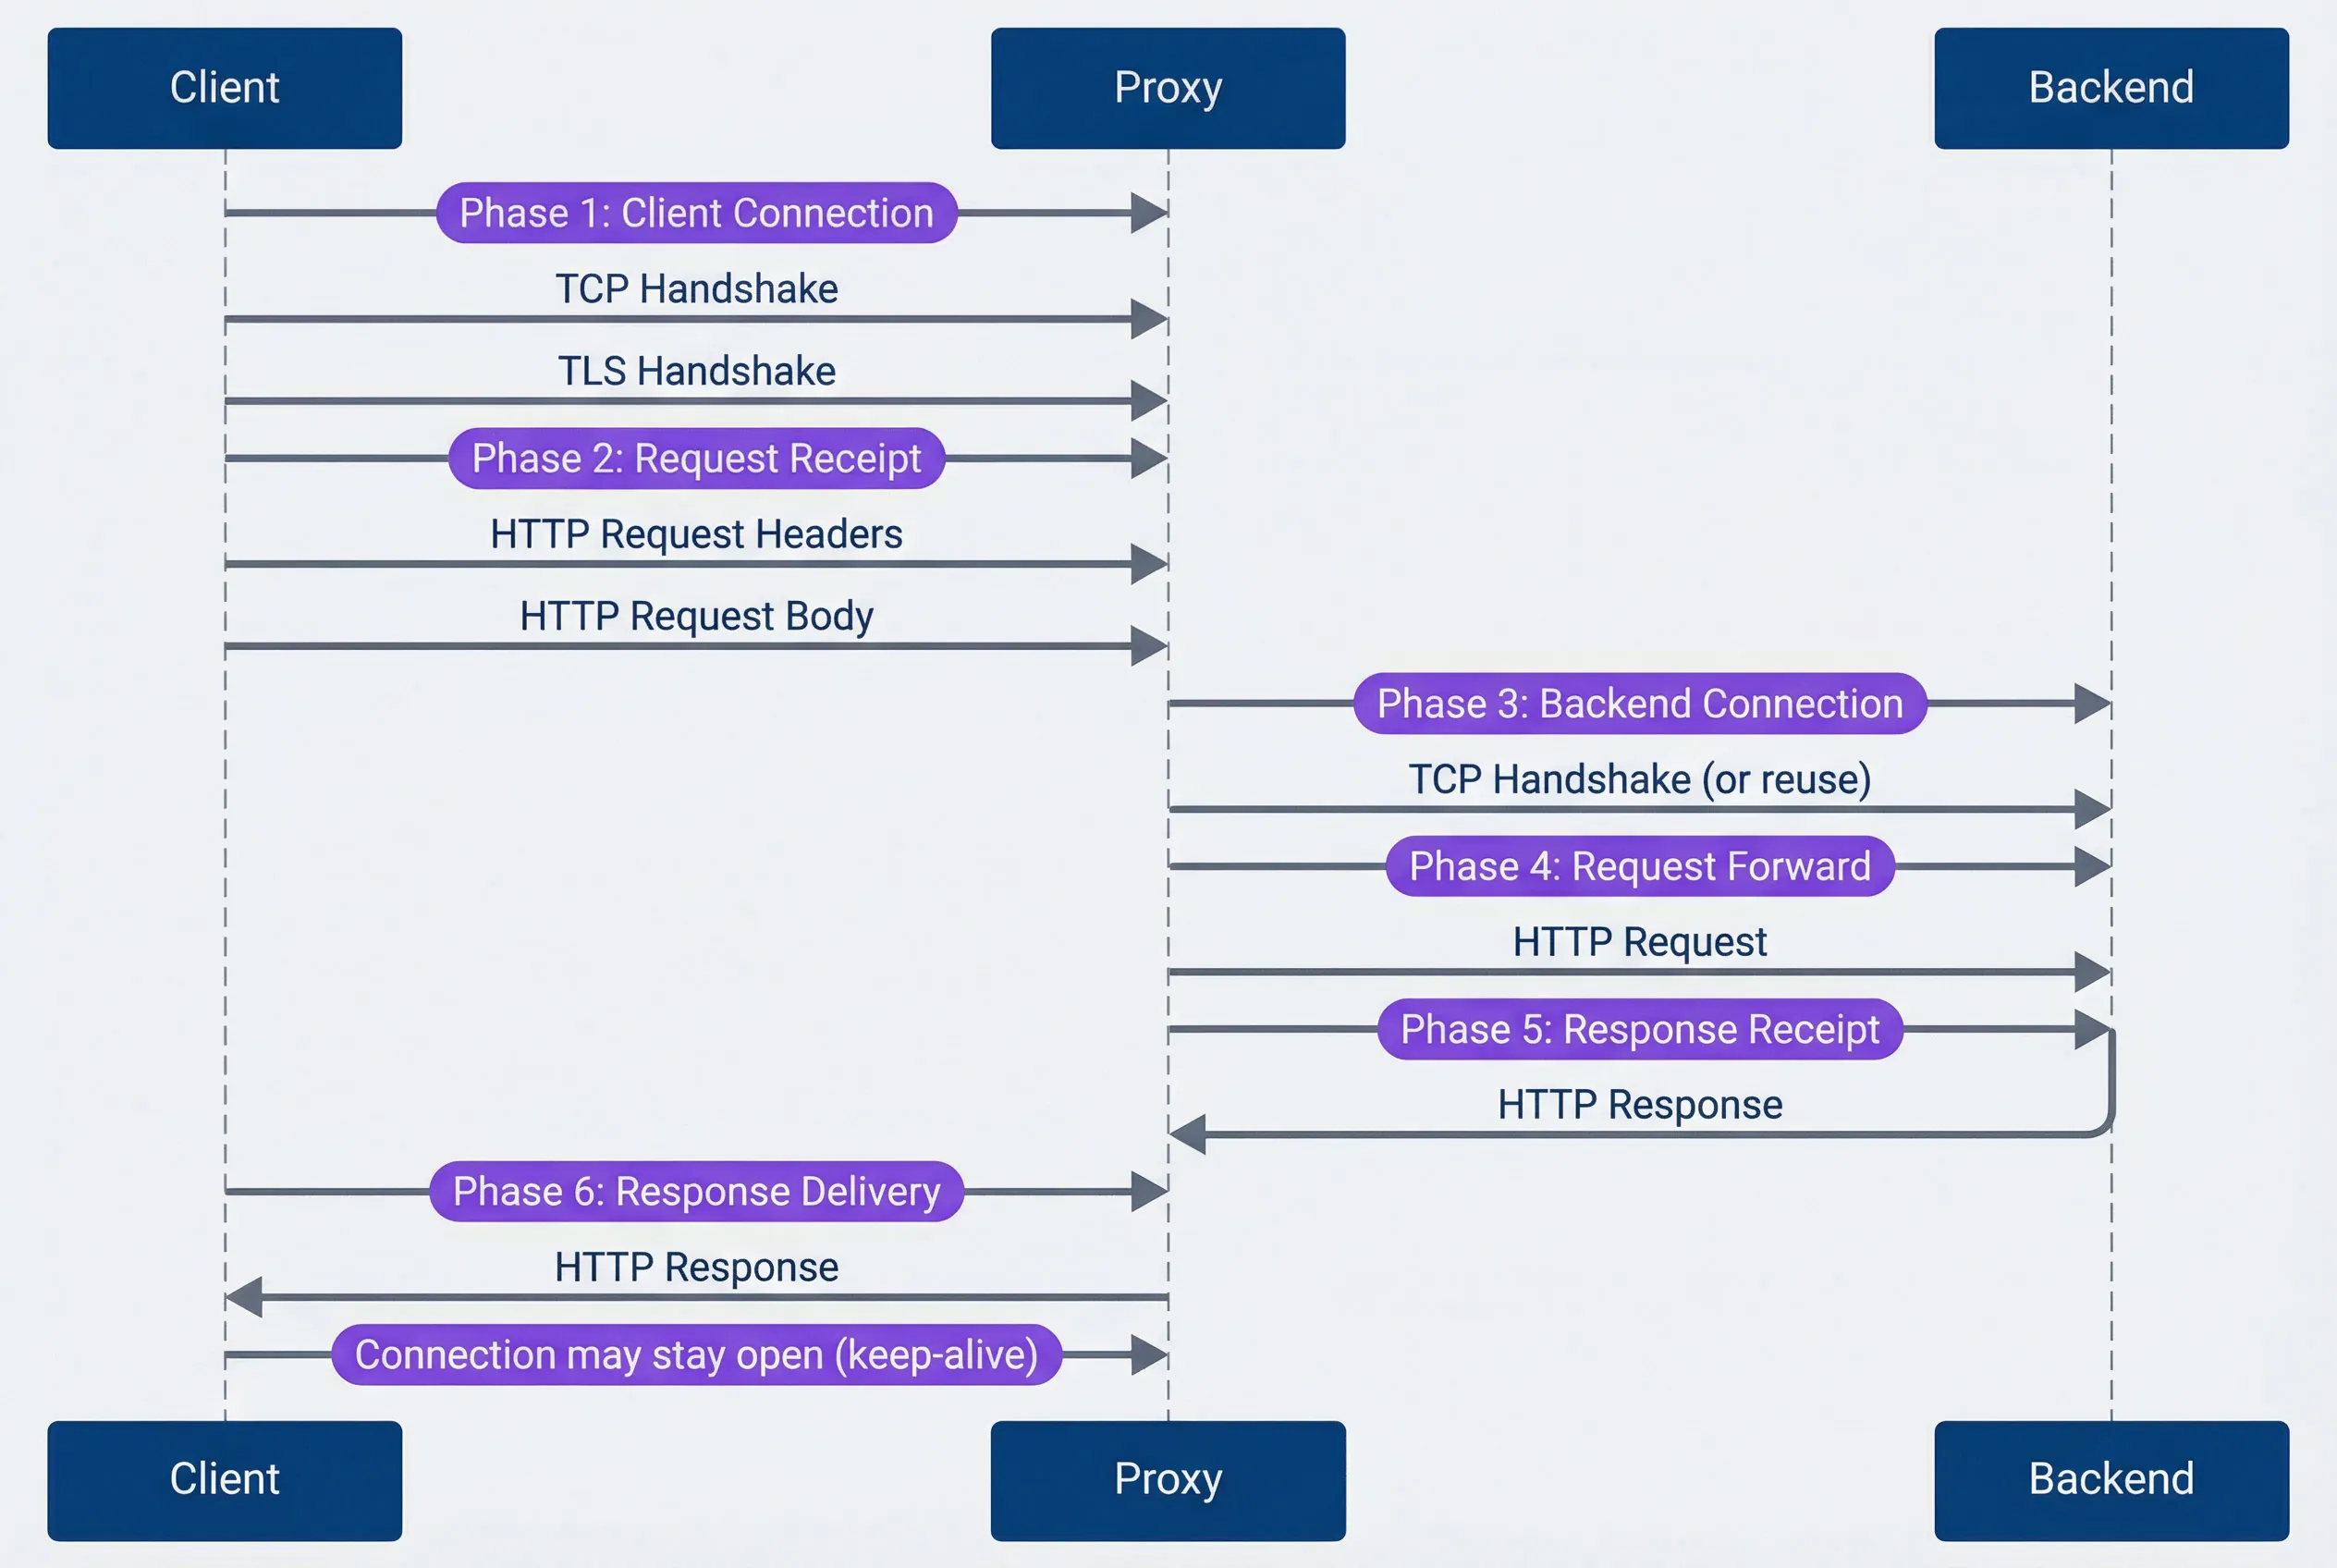
Request flow through reverse proxy.description
Sequence diagram with three participants: Client, Proxy, and Backend. Phase 1 is Client Connection, where the client performs a TCP handshake with the proxy and then a TLS handshake. Phase 2 is Request Receipt, where the client sends HTTP request headers followed by the HTTP request body to the proxy. Phase 3 is Backend Connection, where the proxy opens or reuses a TCP connection to the backend. Phase 4 is Request Forward, where the proxy sends the HTTP request to the backend. Phase 5 is Response Receipt, where the backend returns the HTTP response to the proxy. Phase 6 is Response Delivery, where the proxy sends the HTTP response back to the client. A final note indicates that the client connection may remain open for keep-alive reuse. The diagram maps the full path of a proxied request and highlights where connection, timeout, and buffering settings influence behavior.
Connection Multiplexing
Nginx and HAProxy handle connections differently, and understanding these models helps you size connection limits appropriately.
Nginx uses an event-driven, single-threaded worker model. Each worker process handles thousands of connections using non-blocking I/O, but each connection — whether from a client or to a backend — uses one slot from the worker_connections pool. Since a proxied request needs both a client connection and a backend connection, each request consumes at least two slots. The formula for maximum concurrent requests is roughly:
max concurrent requests = (worker_processes × worker_connections) / 2
With 4 workers and 4096 connections each, you get approximately 8,192 concurrent requests. Keep-alives complicate this — idle connections still consume slots, so you may hit connection limits before CPU or memory becomes a bottleneck.
The worker_processes auto setting tells Nginx to spawn one worker per CPU core, which is usually correct. You might deviate for CPU-bound workloads (fewer workers to reduce context switching) or in containers with CPU limits (set workers explicitly since auto reads the host’s CPU count, not the container’s limit).
HAProxy uses an event-driven, multi-threaded model with more granular controls. You set a global maxconn limit, but you can also set per-frontend and per-backend limits. When a backend reaches its maxconn, HAProxy queues requests rather than rejecting them immediately — the timeout queue setting controls how long requests wait for an available slot.
HTTP/2 changes the equation significantly. A single HTTP/2 connection can multiplex hundreds of concurrent streams (requests). In Nginx, http2_max_concurrent_streams defaults to 128; in HAProxy, tune.h2.max_concurrent_streams defaults to 100. This means one connection slot serves many requests, dramatically improving efficiency for clients that support HTTP/2.
HTTP/3 (QUIC) takes this further by eliminating head-of-line blocking entirely — since it runs over UDP, a lost packet doesn’t stall unrelated streams. Both Nginx and HAProxy have experimental HTTP/3 support, but production adoption is still early. If you’re starting fresh, it’s worth evaluating; for existing deployments, HTTP/2 remains the practical choice.
If you’re proxying gRPC traffic, HTTP/2 is mandatory — gRPC requires it. Make sure both your frontend (client-facing) and backend connections are configured for HTTP/2, or gRPC calls will fail with cryptic errors.
Timeout Configuration
Timeouts are the most common source of proxy-related outages, and the defaults are almost never right for production. Nginx defaults most timeouts to 60 seconds — generous enough to hide problems during development, short enough to cause 502s when a backend occasionally takes 65 seconds. HAProxy is worse: many timeouts have no default, meaning connections can hang indefinitely if you don’t configure them.
The key insight is that timeouts should match your traffic patterns, not arbitrary round numbers. A health check endpoint should respond in milliseconds; a report generation endpoint might legitimately take 5 minutes. Using the same timeout for both means either your health checks are too slow to detect failures, or your reports timeout prematurely.
Nginx Timeout Hierarchy
Nginx organizes timeouts into client-side (receiving requests) and proxy-side (communicating with backends). Most timeouts are per-operation, meaning they reset when data flows — a client uploading a large file won’t timeout as long as chunks keep arriving.
# Nginx timeout configuration - production values

# === Client-side timeouts ===

# Time to wait for client to send request headers
# Default: 60s - Too long for production
client_header_timeout 10s;

# Time to wait for client to send request body
# Per-read, not total. Resets on each chunk received.
# Default: 60s
client_body_timeout 30s;

# Time to wait between writes to client
# If client stops reading, connection closes after this
# Default: 60s
send_timeout 30s;

# Keep-alive timeout (client connection reuse)
# How long to keep idle connections open
# Default: 75s
keepalive_timeout 65s;

# === Proxy/Backend timeouts ===

# Time to establish connection to backend
# Should be short - backends should be reachable quickly
# Default: 60s - Way too long
proxy_connect_timeout 5s;

# Time to wait between writes to backend
# If backend stops accepting data, timeout fires
# Default: 60s
proxy_send_timeout 30s;

# Time to wait for backend to send response body
# Per-read operation, resets on each chunk
# Default: 60s - May need increase for slow endpoints
proxy_read_timeout 60s;

# === Per-location overrides ===
location /api/slow-endpoint {
    # Long-running operations need longer timeouts
    proxy_read_timeout 300s;
}

location /api/uploads {
    # Large uploads need time
    client_body_timeout 120s;
    proxy_send_timeout 120s;
}

location /health {
    # Health checks should be fast
    proxy_connect_timeout 2s;
    proxy_read_timeout 5s;
}
The per-location overrides are essential. A monolithic timeout configuration forces you to set everything to accommodate the slowest endpoint, which masks problems elsewhere. By setting aggressive defaults (5-second connect, 60-second read) and overriding for specific slow paths, you get fast failure detection for most endpoints while still supporting legitimate long-running operations.
HAProxy Timeout Hierarchy
HAProxy’s timeout model differs from Nginx in one critical way: timeout client and timeout server cover the entire request or response, not per-read operations. If you set timeout server 60s and the backend takes 30 seconds to send the first byte, then another 35 seconds to send the body, the connection times out — even though data was flowing the whole time.
# HAProxy timeout configuration - production values

defaults
    mode http

    # === Connection timeouts ===

    # Time to wait for TCP connection to backend
    # Default: no timeout (dangerous!)
    timeout connect 5s

    # Time to wait for client to send data
    # Covers entire request, not per-read
    # Default: no timeout
    timeout client 30s

    # Time to wait for server to send data
    # Covers entire response, not per-read
    # Default: no timeout
    timeout server 60s

    # === HTTP-specific timeouts ===

    # Time to wait for complete HTTP request
    # Protects against slowloris attacks
    # Default: 5s
    timeout http-request 10s

    # Time to wait between requests on keep-alive connection
    # How long to keep connection open waiting for next request
    # Default: no timeout
    timeout http-keep-alive 10s

    # Time to wait in queue for available server
    # When all backend servers are at maxconn
    # Default: no timeout
    timeout queue 30s

    # Time to wait for health check response
    # Default: uses timeout connect + timeout server
    timeout check 5s

    # === Tunnel timeout (websockets, etc.) ===
    # Time for idle bidirectional connection
    timeout tunnel 3600s

# Per-backend overrides
backend slow_api
    timeout server 300s
    timeout queue 60s

backend uploads
    timeout client 120s
    timeout server 120s

backend health_checks
    timeout connect 2s
    timeout server 5s
The timeout queue setting deserves special attention. When all backend servers reach their maxconn limit, HAProxy queues incoming requests rather than rejecting them immediately. This is usually what you want — a brief spike shouldn’t return errors if backends will be available in a few seconds. But if the queue timeout is too long, users wait forever for requests that will eventually fail anyway. 30 seconds is a reasonable default; adjust based on how long users are willing to wait.
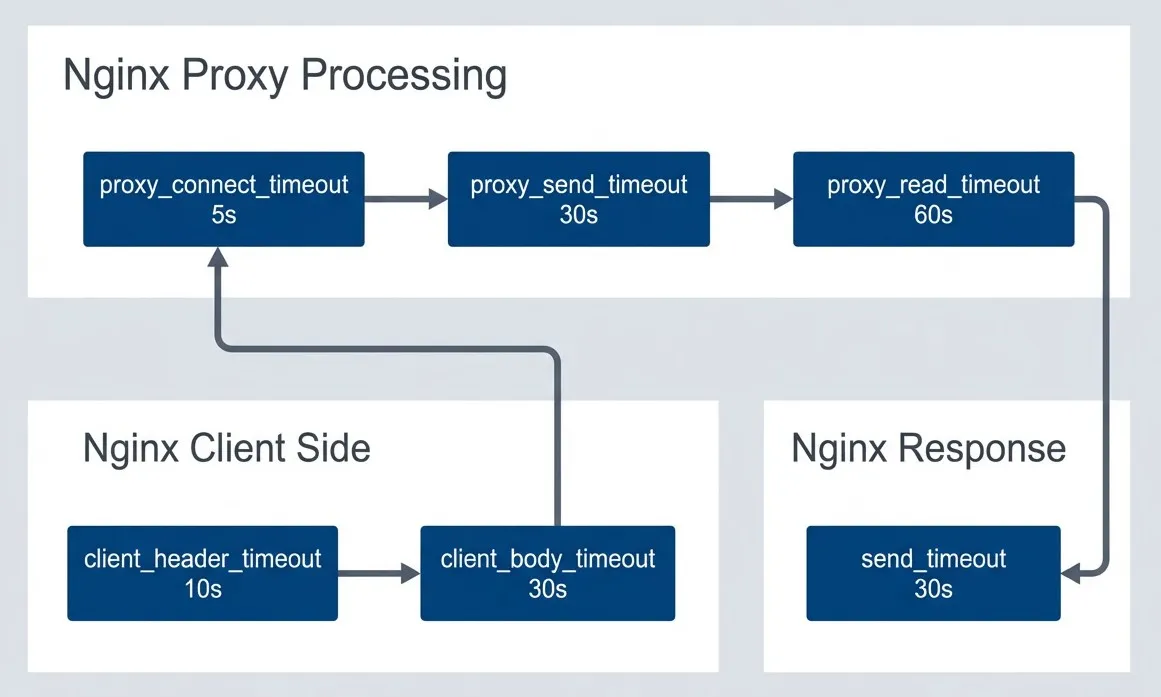
Nginx timeout chain.description
Left-to-right flowchart divided into three grouped sections. The first group, Nginx Client Side, starts with client_header_timeout set to 10 seconds and flows to client_body_timeout set to 30 seconds. The second group, Nginx Proxy Processing, continues from there to proxy_connect_timeout at 5 seconds, then to proxy_send_timeout at 30 seconds, and then to proxy_read_timeout at 60 seconds. The third group, Nginx Response, ends with send_timeout at 30 seconds. The proxy_connect_timeout node is visually highlighted to show its importance in failing fast when a backend cannot be reached. The diagram shows the order in which Nginx timeout settings apply as a request moves from initial client reads through backend communication and back to the client response path.
The following table maps Nginx and HAProxy timeout settings to each other. They’re not exact equivalents — Nginx’s per-read semantics differ from HAProxy’s total-time semantics — but this helps when translating configurations between the two.
| # | Timeout | Nginx | HAProxy | Recommended |
|---|---|---|---|---|
| 1 | Client connect | N/A (kernel) | N/A (kernel) | Kernel default |
| 2 | Client request | client_header_timeout | timeout http-request | 10-30s |
| 3 | Client body | client_body_timeout | timeout client | 30-120s |
| 4 | Backend connect | proxy_connect_timeout | timeout connect | 3-10s |
| 5 | Backend response | proxy_read_timeout | timeout server | 30-300s |
| 6 | Keep-alive idle | keepalive_timeout | timeout http-keep-alive | 30-120s |
The most common timeout mistake: setting proxy_read_timeout too short. A backend that occasionally takes 45 seconds (database query, external API) will cause 502 errors with a 30-second timeout. Know your P99 backend latency and add headroom.
Buffer Tuning
Buffers determine how much data your proxy can hold in memory between clients and backends. Get them wrong and you’ll see one of two problems: undersized buffers cause 400 Bad Request errors (headers too large) or force disk spillover that kills performance; oversized buffers waste memory and can make a high-traffic proxy OOM.
The most common buffer-related issue is authentication headers exceeding the default buffer size. Nginx’s client_header_buffer_size defaults to 1KB, but a request with OAuth tokens, cookies, and correlation headers can easily hit 4-8KB. When headers exceed the primary buffer, Nginx falls back to large_client_header_buffers—if that’s also too small, the client gets a 400 Bad Request with no useful message.
Nginx Buffer Configuration
Nginx separates client-side buffers (receiving requests) from proxy-side buffers (receiving responses from backends). The proxy buffers are where most tuning happens because response sizes vary wildly.
# === Client request buffers ===

# Buffer for reading client request headers
# Default: 1k - Often too small for cookies/auth headers
client_header_buffer_size 4k;

# Fallback large buffers for oversized headers
# number * size - used when header exceeds client_header_buffer_size
# Default: 4 8k
large_client_header_buffers 8 16k;

# Maximum request body size
# 0 = unlimited (dangerous!)
# Default: 1m
client_max_body_size 100m;

# Buffer client request body in memory or disk
# on = use proxy_buffer_size first, then disk
# off = stream to backend immediately
client_body_buffer_size 128k;

# === Proxy response buffers ===

# Buffer for first part of response (headers)
# Should fit typical response headers
# Default: 4k/8k (platform dependent)
proxy_buffer_size 8k;

# Buffers for response body
# number * size total buffering capacity
# Default: 8 4k/8k
proxy_buffers 16 32k;

# How much can be busy sending to client while reading more
# Default: 8k/16k
proxy_busy_buffers_size 64k;

# Maximum size of buffered response
# If response exceeds this, streams directly (slower)
# Default: 256m
proxy_max_temp_file_size 1024m;

# === Buffering behavior ===

# Buffer entire response before sending to client
# on = faster for slow clients, uses memory
# off = streaming, lower memory, can be slower
proxy_buffering on;

# Don't wait for full buffer before sending
# Useful for SSE, streaming responses
# location /events {
#     proxy_buffering off;
# }

# === Per-location tuning ===
location /api/large-response {
    proxy_buffers 32 64k;
    proxy_busy_buffers_size 128k;
}

location /api/streaming {
    proxy_buffering off;
    proxy_read_timeout 3600s;
}
The proxy_buffering directive controls whether Nginx buffers the entire backend response before sending to the client. With buffering on, a backend can finish quickly and move on to the next request even if the client is slow — the proxy holds the response. With buffering off, the backend connection stays open until the client receives everything. For typical APIs, buffering on. For Server-Sent Events, WebSockets, or streaming responses, buffering off.
HAProxy Buffer Configuration
HAProxy uses a simpler buffer model: tune.bufsize controls the buffer size for both requests and responses. Unlike Nginx’s array of buffers, HAProxy uses a single buffer per direction. This makes tuning simpler but less flexible — you can’t have small request buffers and large response buffers.
global
    # Size of buffer for request/response
    # Applied to both directions
    # Default: 16384 (16k)
    tune.bufsize 32768

    # Maximum number of headers
    # Default: 101
    tune.http.maxhdr 128

    # Maximum size of compressed response
    tune.comp.maxlevel 5

    # Maximum memory for SSL session cache
    tune.ssl.cachesize 100000

    # Maximum number of headers to log
    tune.http.logurilen 8192

defaults
    # Maximum request/response size (header + body)
    # Requests exceeding this get 400 error
    # Default: tune.bufsize
    # For large uploads, must increase tune.bufsize

    # Response buffering mode
    # full: buffer entire response
    # auto: decide based on response
    option http-buffer-request

frontend main
    # Rate limiting headers/body
    http-request set-header X-Request-Size %[req.body_size]

    # Reject oversized requests early
    http-request deny if { req.body_size gt 104857600 }

backend api
    # HTTP options
    option httpchk GET /health
    http-check expect status 200

    # Server connection behavior
    http-reuse aggressive
The http-request deny if { req.body_size gt 104857600 } line is worth noting: it rejects oversized requests before buffering them. Without this, HAProxy would accept a 10GB upload attempt before rejecting it — wasting bandwidth and potentially filling disk.
| Scenario | Buffer Setting | Recommendation |
|---|---|---|
| Large cookies/headers | client_header_buffer_size | 4k-16k |
| File uploads | client_body_buffer_size | 128k-1m |
| Large API responses | proxy_buffers | 16-32 × 32k-64k |
| Streaming/SSE | proxy_buffering | off |
| Memory constrained | proxy_max_temp_file_size | Limit spillover |
Quick decision: If you’re seeing 400 Bad Request errors, increase client_header_buffer_size. If backends complain about slow clients, turn proxy_buffering on. If you’re proxying Server-Sent Events or WebSockets, turn proxy_buffering off.
Connection Management
Connection management is where proxies earn their keep. Opening a new TCP connection involves a three-way handshake (50-100ms to a nearby server, 200ms+ cross-region). Add TLS and you’re looking at another round trip or two. At 1000 RPS, if every request opens a new backend connection, you’re spending more time on handshakes than actual work.
The solution is connection pooling: the proxy maintains a pool of open connections to each backend and reuses them across requests. Nginx calls this “upstream keepalive”; HAProxy calls it “connection reuse.” Both dramatically reduce backend latency.
Keep-Alive Tuning
Nginx’s upstream keepalive has a critical gotcha: it requires specific HTTP headers to work. By default, Nginx sends Connection: close to backends, defeating keepalive entirely. You must set proxy_http_version 1.1 and proxy_set_header Connection "" in every location block that uses the upstream.
# === Client-side keep-alive ===

# Enable keep-alive for clients
# Default: on
keepalive_timeout 65s;

# Maximum requests per keep-alive connection
# After this many requests, connection closes
# Default: 100
keepalive_requests 1000;

# Send keep-alive header
# Default: off
keepalive_disable none;

# === Backend keep-alive (upstream) ===

upstream backend {
    server backend1:8080;
    server backend2:8080;

    # Number of idle keep-alive connections to preserve
    # Per worker process!
    # Default: none (new connection per request)
    keepalive 32;

    # Maximum requests per backend keep-alive connection
    # Default: 1000
    keepalive_requests 10000;

    # Idle timeout for backend connections
    # Default: 60s
    keepalive_timeout 60s;
}

server {
    location / {
        proxy_pass http://backend;

        # Required for upstream keep-alive
        proxy_http_version 1.1;
        proxy_set_header Connection "";
    }
}

# === Connection draining ===

# Graceful worker shutdown timeout
# Wait for connections to finish
worker_shutdown_timeout 30s;
The keepalive 32 directive is per worker process, not total. With 4 workers, you’ll have up to 128 idle backend connections (32 × 4). Size this based on your request rate and backend count — too few connections means constant churn, too many wastes backend resources holding idle connections.
HAProxy Connection Pooling
HAProxy’s http-reuse directive controls connection pooling behavior. The aggressive setting reuses connections for all HTTP methods, which is safe for stateless backends. The safe setting only reuses for idempotent methods (GET, HEAD, OPTIONS)—use this if your backends have connection-affinity issues.
The maxconn limits deserve careful thought. The global maxconn caps total proxy connections. Frontend maxconn caps client connections. Backend server maxconn caps connections per backend server. When a server hits its limit, HAProxy queues requests (controlled by timeout queue) rather than overloading the backend.
global
    # Maximum concurrent connections (global limit)
    maxconn 50000

    # Number of threads
    nbthread 4

defaults
    mode http

    # Connection reuse policy
    # safe: reuse only for safe methods
    # aggressive: reuse for all methods
    # always: always reuse (dangerous)
    # never: no reuse
    option http-reuse aggressive

    # Server connection mode
    # http-server-close: close backend conn after response
    # http-keep-alive: keep backend connections open
    option http-server-close

frontend main
    bind *:80

    # Frontend connection limit
    maxconn 40000

    # Connection rate limiting
    rate-limit sessions 1000

    default_backend api

backend api
    # Load balancing algorithm
    balance roundrobin

    # Server definitions with connection limits
    server srv1 backend1:8080 maxconn 500 check
    server srv2 backend2:8080 maxconn 500 check

    # Queue configuration when servers are full
    # timeout queue defined in defaults
    fullconn 800

    # Connection retry
    retries 3
    option redispatch

    # Health checking
    option httpchk GET /health
    http-check expect status 200

    # Slow start - ramp up connections to new server
    server srv3 backend3:8080 maxconn 500 slowstart 30s check
The slowstart option is valuable when bringing new servers online. Without it, a fresh server immediately receives its full share of traffic — which can overwhelm cold caches and unwarmed JVMs. With slowstart 30s, HAProxy gradually increases traffic to the new server over 30 seconds, giving it time to warm up.
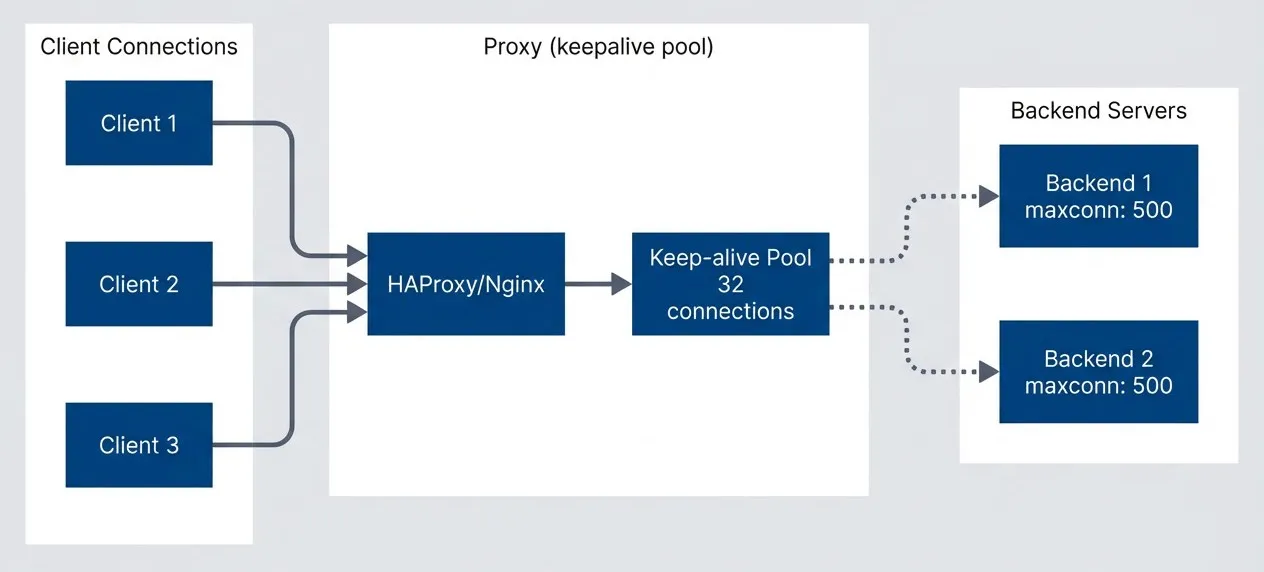
Connection pooling to backends.description
Top-down flowchart with three grouped sections. The first section, Client Connections, contains three separate clients labeled Client 1, Client 2, and Client 3. All three connect to a central proxy component labeled HAProxy or Nginx in the second section, Proxy keepalive pool. That proxy feeds into a highlighted Keep-alive Pool node labeled 32 connections. The keep-alive pool then connects to two backend servers in the third section, Backend Servers, labeled Backend 1 and Backend 2, each with maxconn 500. The diagram shows that many client connections can be funneled through a smaller reusable pool of backend connections, which reduces repeated TCP or TLS handshake overhead and lowers backend connection churn.
Backend keep-alive is often more important than client keep-alive. Each new backend connection requires a TCP handshake (and potentially TLS). A keep-alive pool dramatically reduces backend latency and load.
Load Balancing Configuration
Load balancing distributes traffic across backend servers. The choice of algorithm matters less than people think — round-robin works fine for most stateless services — but getting it wrong causes real problems. Session affinity (“sticky sessions”) on a stateless service wastes capacity; no affinity on a stateful service causes session corruption.
Algorithm Selection
Round-robin is the default and usually correct for stateless microservices. It distributes traffic evenly regardless of what backends are doing. Least-connections works better when request durations vary significantly — a reporting endpoint that takes 30 seconds shouldn’t receive new requests at the same rate as a health check endpoint.
IP hash provides basic session affinity without cookies, but it’s fragile: clients behind NAT share an IP, mobile clients change IPs frequently, and CDNs mask the original IP. Cookie-based affinity (HAProxy’s cookie directive or Nginx Plus’s sticky cookies) is more reliable when you actually need sessions.
# Round-robin (default)
# Simple rotation through servers
upstream backend_rr {
    server backend1:8080;
    server backend2:8080;
    server backend3:8080;
}

# Least connections
# Send to server with fewest active connections
upstream backend_lc {
    least_conn;
    server backend1:8080;
    server backend2:8080;
    server backend3:8080;
}

# IP hash (sticky sessions)
# Same client IP goes to same server
upstream backend_ip {
    ip_hash;
    server backend1:8080;
    server backend2:8080;
    server backend3:8080;
}

# Weighted distribution
# Higher weight = more traffic
upstream backend_weighted {
    server backend1:8080 weight=5;  # 50% of traffic
    server backend2:8080 weight=3;  # 30% of traffic
    server backend3:8080 weight=2;  # 20% of traffic
}

# Health checks and failure handling
upstream backend_resilient {
    server backend1:8080 max_fails=3 fail_timeout=30s;
    server backend2:8080 max_fails=3 fail_timeout=30s;
    server backend3:8080 backup;  # Only used when others fail

    keepalive 32;
}

# Hash on custom key (e.g., user ID)
upstream backend_hash {
    hash $request_uri consistent;
    server backend1:8080;
    server backend2:8080;
    server backend3:8080;
}
The consistent modifier on hash-based balancing is important for caching use cases. Without it, adding or removing a server rehashes all requests to new backends, invalidating caches. With consistent hashing, only requests that were going to the added/removed server get redistributed.
HAProxy Advanced Load Balancing
HAProxy offers more sophisticated options, including agent checks where backends report their own health and capacity. The random(2) algorithm (“power of two choices”) is interesting: it picks two servers randomly and sends the request to whichever has fewer connections. This provides near-optimal distribution without the overhead of tracking all server states.
backend api
    # === Balancing Algorithms ===

    # Round-robin (default)
    balance roundrobin

    # Least connections
    # balance leastconn

    # Source IP hash (sticky)
    # balance source

    # URI hash (cache efficiency)
    # balance uri

    # Header-based hash
    # balance hdr(X-User-ID)

    # Random with power of two choices
    # balance random(2)

    # === Server weights and options ===
    server srv1 backend1:8080 weight 100 check
    server srv2 backend2:8080 weight 100 check
    server srv3 backend3:8080 weight 50 check  # Half traffic

    # === Advanced options ===

    # Dynamic weight adjustment based on health
    option httpchk GET /health
    http-check expect status 200
    default-server inter 3s fall 3 rise 2

    # Slow start - gradually increase traffic to new/recovered server
    default-server slowstart 60s

    # Agent check - backend reports own health/weight
    # server srv1 backend1:8080 check agent-check agent-port 8081

backend sticky_sessions
    # Cookie-based sticky sessions
    balance roundrobin
    cookie SERVERID insert indirect nocache
    server srv1 backend1:8080 cookie s1 check
    server srv2 backend2:8080 cookie s2 check

backend canary
    # Weighted canary deployment
    server stable backend-stable:8080 weight 95 check
    server canary backend-canary:8080 weight 5 check
The canary deployment example shows a common pattern: routing 5% of traffic to a new version while 95% goes to the stable version. If the canary starts failing health checks or returning errors, you can quickly shift traffic back to stable by adjusting weights or marking the canary server as disabled.
| # | Algorithm | Use Case | Session Affinity | Even Distribution |
|---|---|---|---|---|
| 1 | Round-robin | Stateless services | No | Yes |
| 2 | Least-conn | Varying request duration | No | Adaptive |
| 3 | IP hash | Simple session affinity | Yes (IP-based) | Depends on IPs |
| 4 | Cookie | Reliable session affinity | Yes (cookie) | Yes |
| 5 | URI hash | Caching proxies | Yes (URL-based) | Depends on URLs |
For stateless services, least_conn often outperforms round_robin when request durations vary significantly. It naturally avoids sending requests to servers still processing slow requests.
SSL/TLS Optimization
TLS termination at the proxy is almost always correct. Backends can run plain HTTP (simpler, faster, easier to debug), while clients get proper encryption. The proxy handles certificate management, cipher negotiation, and session caching — concerns you don’t want duplicated across dozens of backend services.
The performance cost of TLS is often overstated. Modern CPUs have AES-NI1 instructions that make symmetric encryption nearly free. The real cost is in handshakes: each new connection requires asymmetric cryptography and certificate verification. Session caching and TLS 1.3’s faster handshake mitigate this.
Certificate and Protocol Configuration
TLS 1.2 is the minimum acceptable version in 2025; TLS 1.3 is preferred and required by some compliance frameworks. Don’t enable TLS 1.0 or 1.1—they have known vulnerabilities and modern browsers don’t use them anyway.
OCSP stapling is worth enabling: instead of clients checking certificate revocation with the CA (adding latency), your proxy includes a signed timestamp proving the certificate wasn’t revoked. This eliminates a round trip to the CA on each new connection.
Start with certificates and protocol versions:
server {
    listen 443 ssl http2;
    server_name example.com;

    # Certificates
    ssl_certificate /etc/nginx/ssl/fullchain.pem;
    ssl_certificate_key /etc/nginx/ssl/privkey.pem;

    # TLS 1.2 minimum (1.3 preferred)
    ssl_protocols TLSv1.2 TLSv1.3;

    # Prefer server cipher order with modern ciphers
    ssl_prefer_server_ciphers on;
    ssl_ciphers ECDHE-ECDSA-AES128-GCM-SHA256:ECDHE-RSA-AES128-GCM-SHA256:ECDHE-ECDSA-AES256-GCM-SHA384:ECDHE-RSA-AES256-GCM-SHA384;
}
Session caching reduces TLS handshake overhead by allowing clients to resume previous sessions. The shared:SSL:50m cache is shared across all worker processes:
server {
    # Shared cache across workers (50MB)
    ssl_session_cache shared:SSL:50m;
    ssl_session_timeout 1d;

    # Session tickets (alternative to cache)
    ssl_session_tickets on;
    ssl_session_ticket_key /etc/nginx/ssl/ticket.key;
}

# Generate session ticket key:
# openssl rand 80 > /etc/nginx/ssl/ticket.key
OCSP stapling and DH parameters complete the configuration:
server {
    # OCSP Stapling
    ssl_stapling on;
    ssl_stapling_verify on;
    ssl_trusted_certificate /etc/nginx/ssl/chain.pem;
    resolver 8.8.8.8 8.8.4.4 valid=300s;
    resolver_timeout 5s;

    # DH Parameters (generate with: openssl dhparam -out dhparam.pem 2048)
    ssl_dhparam /etc/nginx/ssl/dhparam.pem;

    # Early data (0-RTT) - careful: replay attacks possible
    ssl_early_data on;
    proxy_set_header Early-Data $ssl_early_data;
}
The ssl_early_data directive enables TLS 1.3’s 0-RTT feature, allowing clients to send data on the first packet of a resumed connection. This is genuinely faster but introduces replay attack risk — a captured request could be replayed by an attacker. Only enable this for idempotent endpoints, and have backends check the Early-Data header.
HAProxy SSL Configuration
HAProxy can handle multiple certificates from a directory (crt /etc/haproxy/certs/) and automatically selects the right one based on SNI. This makes certificate management simpler than Nginx’s approach of listing each certificate explicitly.
The ssl verify required ca-file option for backend connections is important for zero-trust architectures2 where even internal traffic should be encrypted and authenticated.
global
    # SSL/TLS defaults
    ssl-default-bind-ciphers ECDHE-ECDSA-AES128-GCM-SHA256:ECDHE-RSA-AES128-GCM-SHA256:ECDHE-ECDSA-AES256-GCM-SHA384:ECDHE-RSA-AES256-GCM-SHA384
    ssl-default-bind-ciphersuites TLS_AES_128_GCM_SHA256:TLS_AES_256_GCM_SHA384:TLS_CHACHA20_POLY1305_SHA256
    ssl-default-bind-options ssl-min-ver TLSv1.2 no-tls-tickets

    ssl-default-server-ciphers ECDHE-ECDSA-AES128-GCM-SHA256:ECDHE-RSA-AES128-GCM-SHA256
    ssl-default-server-options ssl-min-ver TLSv1.2

    # SSL session cache
    tune.ssl.cachesize 100000
    tune.ssl.lifetime 600

    # SSL memory limits
    tune.ssl.maxrecord 16384

frontend https
    bind *:443 ssl crt /etc/haproxy/certs/ alpn h2,http/1.1

    # SNI-based routing
    use_backend api if { ssl_fc_sni -i api.example.com }
    use_backend web if { ssl_fc_sni -i www.example.com }

    # HSTS header
    http-response set-header Strict-Transport-Security "max-age=31536000; includeSubDomains"

    default_backend web

backend api
    # Backend over TLS
    server srv1 backend1:8443 ssl verify required ca-file /etc/haproxy/ca.pem check

    # Backend with client certificate
    # server srv1 backend1:8443 ssl crt /etc/haproxy/client.pem verify required ca-file /etc/haproxy/ca.pem

frontend tcp_passthrough
    bind *:8443
    mode tcp

    # TCP-level SNI inspection
    tcp-request inspect-delay 5s
    tcp-request content accept if { req_ssl_hello_type 1 }

    use_backend passthrough if { req_ssl_sni -i passthrough.example.com }
The TCP passthrough frontend (mode tcp) is useful when you need to route encrypted traffic without terminating TLS. HAProxy inspects just the SNI hostname in the TLS handshake to make routing decisions, then passes the encrypted connection directly to the backend. This preserves end-to-end encryption when required.
| Optimization | Impact | Trade-off |
|---|---|---|
| Session cache | Reduces handshakes | Memory usage |
| OCSP stapling | Faster validation | Requires resolver |
| TLS 1.3 | Faster handshake, better security | Client support |
| HTTP/2 | Multiplexing, fewer connections | Complexity |
| Early data (0-RTT) | Faster first request | Replay risk |
TLS 1.3’s 0-RTT (early data) is vulnerable to replay attacks. Only enable it for idempotent requests (GET), and ensure backends check the Early-Data header to handle replays appropriately.
Monitoring and Observability
You can’t tune what you can’t measure. Before making any production changes, establish baseline metrics: request rate, error rate, latency percentiles (P50, P95, P99), and connection counts. Without these, you’re guessing.
Both Nginx and HAProxy expose metrics, but their approaches differ. Nginx’s stub_status module provides basic connection counts. For detailed metrics, you need the commercial Nginx Plus or the open-source VTS module. HAProxy’s built-in stats page is more comprehensive out of the box, showing per-backend health, queue depths, and response time histograms.
Nginx Metrics and Logging
The most valuable Nginx metrics for production debugging are the upstream timing variables. $upstream_connect_time tells you how long it took to establish a connection to the backend — high values here indicate backend TCP backlog issues or network problems. $upstream_response_time is the total time from connection to last byte received. Comparing this to $request_time (total request duration including client delivery) reveals where latency actually occurs.
# === Status module (basic metrics) ===
server {
    listen 8080;

    location /nginx_status {
        stub_status on;
        allow 10.0.0.0/8;
        deny all;
    }
}

# Output:
# Active connections: 291
# server accepts handled requests
# 16630948 16630948 31070465
# Reading: 6 Writing: 179 Waiting: 106

# === Enhanced logging ===
log_format detailed '$remote_addr - $remote_user [$time_local] '
                    '"$request" $status $body_bytes_sent '
                    '"$http_referer" "$http_user_agent" '
                    'rt=$request_time uct="$upstream_connect_time" '
                    'uht="$upstream_header_time" urt="$upstream_response_time" '
                    'cs=$upstream_cache_status';

log_format json escape=json '{'
    '"time":"$time_iso8601",'
    '"remote_addr":"$remote_addr",'
    '"method":"$request_method",'
    '"uri":"$uri",'
    '"status":$status,'
    '"body_bytes":$body_bytes_sent,'
    '"request_time":$request_time,'
    '"upstream_time":"$upstream_response_time",'
    '"upstream_addr":"$upstream_addr"'
'}';

access_log /var/log/nginx/access.log detailed;
# access_log /var/log/nginx/access.json.log json;

# === Error categorization ===
# Log 4xx/5xx to separate file
map $status $loggable {
    ~^[45] 1;
    default 0;
}

access_log /var/log/nginx/errors.log detailed if=$loggable;

# === Prometheus exporter ===
# Use nginx-prometheus-exporter with stub_status
# or nginx-vts-module for detailed metrics
The JSON log format is worth adopting early. It’s slightly more verbose but makes log analysis with tools like Loki, Elasticsearch, or even jq dramatically easier. Structured logs let you query by status code, latency range, or upstream server without regex gymnastics.
Neither Nginx nor HAProxy natively supports binary log formats. Both write text-based logs (plain or JSON). For high-throughput scenarios where logging becomes a bottleneck, consider writing logs to a RAM disk and rotating frequently, using syslog with UDP transport to an external aggregator, or disabling access logging entirely for health check endpoints.
HAProxy Statistics
HAProxy’s stats page is surprisingly powerful. It shows real-time connection counts, queue depths, server health, and response time distributions per backend. The Prometheus exporter endpoint (/metrics) makes integrating with modern observability stacks trivial — just point Prometheus at it.
frontend stats
    bind *:8404

    # Enable stats page
    stats enable
    stats uri /stats
    stats refresh 10s
    stats auth admin:secure_password

    # Prometheus metrics endpoint
    http-request use-service prometheus-exporter if { path /metrics }

# === Built-in metrics ===
# Frontend: sessions, bytes, requests, errors
# Backend: sessions, bytes, health, queue, response time
# Server: sessions, bytes, health, weight, queue

# === Log format for analysis ===
defaults
    mode http
    option httplog

    # Detailed log format
    log-format "%ci:%cp [%tr] %ft %b/%s %TR/%Tw/%Tc/%Tr/%Ta %ST %B %CC %CS %tsc %ac/%fc/%bc/%sc/%rc %sq/%bq %hr %hs %{+Q}r"

    # JSON log format (alternative)
    # log-format '{"client":"%ci","frontend":"%f","backend":"%b","server":"%s","status":%ST,"bytes":%B,"time_total":%Ta,"time_response":%Tr}'

# === Health check logging ===
backend api
    option log-health-checks
    server srv1 backend1:8080 check
The %TR/%Tw/%Tc/%Tr/%Ta timing fields in HAProxy’s log format break down request processing: TR is request receive time, Tw is queue wait time, Tc is backend connect time, Tr is backend response time, Ta is total active time. When debugging slow requests, these distinctions matter — a high Tw means your backends are overloaded, while a high Tc means backend TCP accept queues are full.
Alerting on Proxy Metrics
Effective alerts focus on symptoms, not causes. Alert on “5xx error rate above 5%” rather than “nginx worker CPU above 80%.” The error rate directly indicates user impact; the CPU might be high for perfectly acceptable reasons.
groups:
  - name: proxy_alerts
    rules:
      - alert: HighErrorRate
        expr: |
          sum(rate(nginx_http_requests_total{status=~"5.."}[5m])) /
          sum(rate(nginx_http_requests_total[5m])) > 0.05
        for: 5m
        labels:
          severity: critical
        annotations:
          summary: "High 5xx error rate ({{ $value | humanizePercentage }})"

      - alert: HighLatency
        expr: |
          histogram_quantile(0.99,
            rate(nginx_http_request_duration_seconds_bucket[5m])
          ) > 2
        for: 5m
        labels:
          severity: warning
        annotations:
          summary: "P99 latency above 2 seconds"

      - alert: BackendDown
        expr: haproxy_server_up == 0
        for: 1m
        labels:
          severity: critical
        annotations:
          summary: "Backend server {{ $labels.server }} is down"

      - alert: HighConnectionCount
        expr: nginx_connections_active > 10000
        for: 5m
        labels:
          severity: warning
        annotations:
          summary: "High active connection count"

      - alert: HighQueueDepth
        expr: haproxy_backend_current_queue > 100
        for: 2m
        labels:
          severity: warning
        annotations:
summary: "Backend queue depth high"The queue depth alert (haproxy_backend_current_queue > 100) is particularly valuable. A growing queue means backends can’t keep up with incoming traffic — you’re either under-provisioned or experiencing a backend problem. This often precedes user-visible errors by minutes, giving you time to react.
Log upstream timing ($upstream_response_time) separately from total request time ($request_time). The difference reveals how much time is spent in the proxy itself — useful for debugging proxy overhead vs. backend slowness.
Production Hardening Checklist
Beyond performance tuning, production proxies need security hardening. A misconfigured proxy can leak internal server information, allow request smuggling attacks, or become an amplifier for DDoS attacks.
Security Configuration
Start with the basics: hide version information (server_tokens off), add security headers, and implement rate limiting. Rate limiting at the proxy layer is your first line of defense against abuse — it protects backends from being overwhelmed by a single misbehaving client.
# === Hide version ===
server_tokens off;

# === Security headers ===
add_header X-Frame-Options "SAMEORIGIN" always;
add_header X-Content-Type-Options "nosniff" always;
add_header Referrer-Policy "strict-origin-when-cross-origin" always;

# HSTS (enable after testing)
add_header Strict-Transport-Security "max-age=31536000; includeSubDomains" always;

# === Rate limiting ===
limit_req_zone $binary_remote_addr zone=api:10m rate=10r/s;
limit_conn_zone $binary_remote_addr zone=conn:10m;

server {
    location /api/ {
        limit_req zone=api burst=20 nodelay;
        limit_conn conn 10;

        proxy_pass http://backend;
    }
}

# === Request filtering ===
# Block common attacks
location ~* "(base64_encode|eval\(|javascript:)" {
    return 403;
}

# Block sensitive paths
location ~ /\. {
    deny all;
}

# === Client restrictions ===
# Maximum header size
large_client_header_buffers 4 8k;

# Maximum body size
client_max_body_size 10m;

# Maximum URI length
# Handled by large_client_header_buffers
The security headers serve distinct purposes. X-Frame-Options: SAMEORIGIN prevents clickjacking by blocking your pages from being embedded in iframes on other domains. X-Content-Type-Options: nosniff stops browsers from MIME-sniffing responses away from their declared content type — a common vector for XSS attacks. Strict-Transport-Security (HSTS) tells browsers to only connect via HTTPS for the specified duration; once set, even typing http:// will redirect to HTTPS before the request leaves the browser.
The limit_req directive with burst and nodelay is the most useful rate limiting pattern. The base rate (10r/s in this example) controls sustained throughput, while the burst (20) allows brief spikes without rejecting requests. The nodelay option serves burst requests immediately rather than spacing them out.
Complete Production Config Example
Here’s a complete Nginx configuration incorporating everything discussed. This isn’t copy-paste ready — your values will differ based on traffic patterns, backend capabilities, and compliance requirements — but it demonstrates how the pieces fit together.
Start with the main context and events block. The worker_rlimit_nofile setting increases the file descriptor limit per worker, essential when handling many concurrent connections:
worker_processes auto;
worker_rlimit_nofile 65535;
pid /run/nginx.pid;

events {
    worker_connections 4096;
    use epoll;
    multi_accept on;
}
The http block contains global settings that apply to all virtual hosts. Timeouts and buffers here serve as defaults that individual locations can override:
http {
    # Basic settings
    sendfile on;
    tcp_nopush on;
    tcp_nodelay on;
    types_hash_max_size 2048;
    server_tokens off;

    include /etc/nginx/mime.types;
    default_type application/octet-stream;

    # Logging with upstream timing
    log_format main '$remote_addr - $remote_user [$time_local] "$request" '
                    '$status $body_bytes_sent "$http_referer" '
                    '"$http_user_agent" rt=$request_time '
                    'uct=$upstream_connect_time uht=$upstream_header_time '
                    'urt=$upstream_response_time';

    access_log /var/log/nginx/access.log main buffer=16k flush=2m;
    error_log /var/log/nginx/error.log warn;

    # Timeouts
    client_header_timeout 10s;
    client_body_timeout 30s;
    send_timeout 30s;
    keepalive_timeout 65s;
    keepalive_requests 1000;

    # Buffers
    client_header_buffer_size 4k;
    large_client_header_buffers 8 16k;
    client_body_buffer_size 128k;
    client_max_body_size 100m;

    # Proxy defaults
    proxy_connect_timeout 5s;
    proxy_send_timeout 30s;
    proxy_read_timeout 60s;
    proxy_buffer_size 8k;
    proxy_buffers 16 32k;
    proxy_busy_buffers_size 64k;

    # Compression
    gzip on;
    gzip_vary on;
    gzip_proxied any;
    gzip_comp_level 5;
    gzip_types text/plain text/css application/json application/javascript text/xml application/xml;

    # Rate limiting zones
    limit_req_zone $binary_remote_addr zone=api:10m rate=100r/s;
    limit_conn_zone $binary_remote_addr zone=conn:10m;
}
The upstream and server blocks define the backend pool and virtual host. Note the keepalive 32 on the upstream and the required proxy_http_version 1.1 with empty Connection header to enable backend connection reuse:
http {
    upstream backend {
        least_conn;
        server backend1:8080 max_fails=3 fail_timeout=30s;
        server backend2:8080 max_fails=3 fail_timeout=30s;
        keepalive 32;
        keepalive_requests 10000;
        keepalive_timeout 60s;
    }

    server {
        listen 443 ssl http2;
        server_name example.com;

        # SSL
        ssl_certificate /etc/nginx/ssl/fullchain.pem;
        ssl_certificate_key /etc/nginx/ssl/privkey.pem;
        ssl_protocols TLSv1.2 TLSv1.3;
        ssl_ciphers ECDHE-ECDSA-AES128-GCM-SHA256:ECDHE-RSA-AES128-GCM-SHA256;
        ssl_prefer_server_ciphers on;
        ssl_session_cache shared:SSL:50m;
        ssl_session_timeout 1d;
        ssl_stapling on;
        ssl_stapling_verify on;

        # Security headers
        add_header X-Frame-Options "SAMEORIGIN" always;
        add_header X-Content-Type-Options "nosniff" always;
        add_header Strict-Transport-Security "max-age=31536000" always;

        location / {
            limit_req zone=api burst=50 nodelay;
            limit_conn conn 20;

            proxy_pass http://backend;
            proxy_http_version 1.1;
            proxy_set_header Connection "";
            proxy_set_header Host $host;
            proxy_set_header X-Real-IP $remote_addr;
            proxy_set_header X-Forwarded-For $proxy_add_x_forwarded_for;
            proxy_set_header X-Forwarded-Proto $scheme;
        }

        location /health {
            access_log off;
            proxy_pass http://backend;
            proxy_connect_timeout 2s;
            proxy_read_timeout 5s;
        }
    }
}
Note the buffer=16k flush=2m on the access log — this buffers log writes to reduce disk I/O, flushing every 2 minutes or when the buffer fills. At high request rates, unbuffered logging becomes a bottleneck.
| # | Category | Default | Production | Why |
|---|---|---|---|---|
| 1 | worker_connections | 1024 | 4096+ | Handle more concurrent connections |
| 2 | keepalive_timeout | 75s | 65s | Balance reuse vs. resource usage |
| 3 | proxy_connect_timeout | 60s | 5s | Fail fast on unreachable backends |
| 4 | proxy_buffers | 8 4k | 16 32k | Handle larger responses |
| 5 | ssl_session_cache | none | shared:50m | Reduce TLS handshakes |
Before deploying configuration changes to production, test under realistic load. Use tools like wrk, hey, or k6 to simulate traffic patterns. Configuration that works at 100 RPS may fail at 10,000 RPS.
Applying Configuration Changes
Both Nginx and HAProxy support graceful reloads that apply new configurations without dropping active connections. For Nginx, nginx -s reload spawns new workers with the new config while existing workers finish their current requests. HAProxy’s systemctl reload haproxy (or -sf flag for seamless reload) does the same. In Kubernetes, the ingress controller handles this automatically when ConfigMaps change.
The key is testing configuration syntax before reloading. A syntax error during reload can leave you with no running workers. Always run nginx -t or haproxy -c -f /etc/haproxy/haproxy.cfg first.
Conclusion
Proxy defaults are starting points, not production configurations. Nginx’s 60-second timeouts and HAProxy’s unlimited defaults exist to avoid breaking things during development — they’re the wrong choices for production.
The tuning process follows a pattern: establish baseline metrics, identify bottlenecks, adjust configuration, measure again. Timeouts should match your traffic patterns — slow report endpoints need longer read timeouts, health checks need aggressive timeouts that fail fast. Buffers should accommodate your payloads without wasting memory. Connection pools should be sized for your request rate and backend count.
The goal isn’t a perfectly optimized configuration — it’s a resilient one. Your proxy should handle normal traffic with good performance, absorb traffic spikes without dropping connections, and shed load gracefully when backends struggle. Test under failure conditions: simulate slow backends, connection storms, and oversized payloads. The problems you find in staging won’t page you at 3 AM.
Footnotes
-
Intel AES-NI (Advanced Encryption Standard New Instructions) is a hardware-based extension for x86 processors (Intel and AMD) designed to significantly speed up data encryption and decryption. It uses specific CPU instructions to handle complex cryptographic calculations, providing 3x to 10x faster performance while reducing CPU load compared to software-only implementations.
↩ -
Zero-trust architecture is a security model that assumes no implicit trust for any user, device, or network — even within the corporate perimeter. Every request must be authenticated, authorized, and encrypted regardless of where it originates. In practice, this means TLS everywhere (not just at the edge), mutual TLS between services, and continuous verification rather than one-time authentication at the network boundary.
↩
Sharethisarticle
Enjoyed the read? Share it with your network.




