
HPA Autoscaling: Signals, Delays, and Traps


Table of Contents
The Horizontal Pod Autoscaler (HPA) looks deceptively simple: set a target CPU percentage, and Kubernetes scales your pods automatically. In practice, teams discover that HPA reacts too slowly to traffic spikes, oscillates between scaling up and down, or scales on entirely the wrong signals. The gap between “HPA works” and “HPA works well for my traffic pattern” is where most autoscaling frustration lives.
I’ve watched this play out repeatedly. An e-commerce team configures HPA with a 50% CPU target. During a flash sale, traffic spikes 10x in 30 seconds. HPA takes 15 seconds to detect the load via the metrics server, another 15 seconds for the controller sync, then the stabilization window kicks in. Meanwhile, new pods need to be scheduled, images pulled, and readiness probes passed. By the time capacity catches up—3+ minutes later — frustrated users have already left. The service survived, but barely.
HPA responds to current conditions, not anticipated load. If your traffic can spike faster than HPA can respond (typically 30-90 seconds minimum), you need either pre-scaling for known events, higher baseline capacity, or request queuing to absorb the delay.
The lesson: HPA is reactive, not predictive. By the time it decides to scale, your workload is already under stress. The goal of HPA tuning is to minimize that reaction time while avoiding oscillation — a balance that requires understanding your traffic patterns, choosing the right metrics, and configuring stabilization windows that match your workload’s characteristics.
HPA Fundamentals
How HPA Works
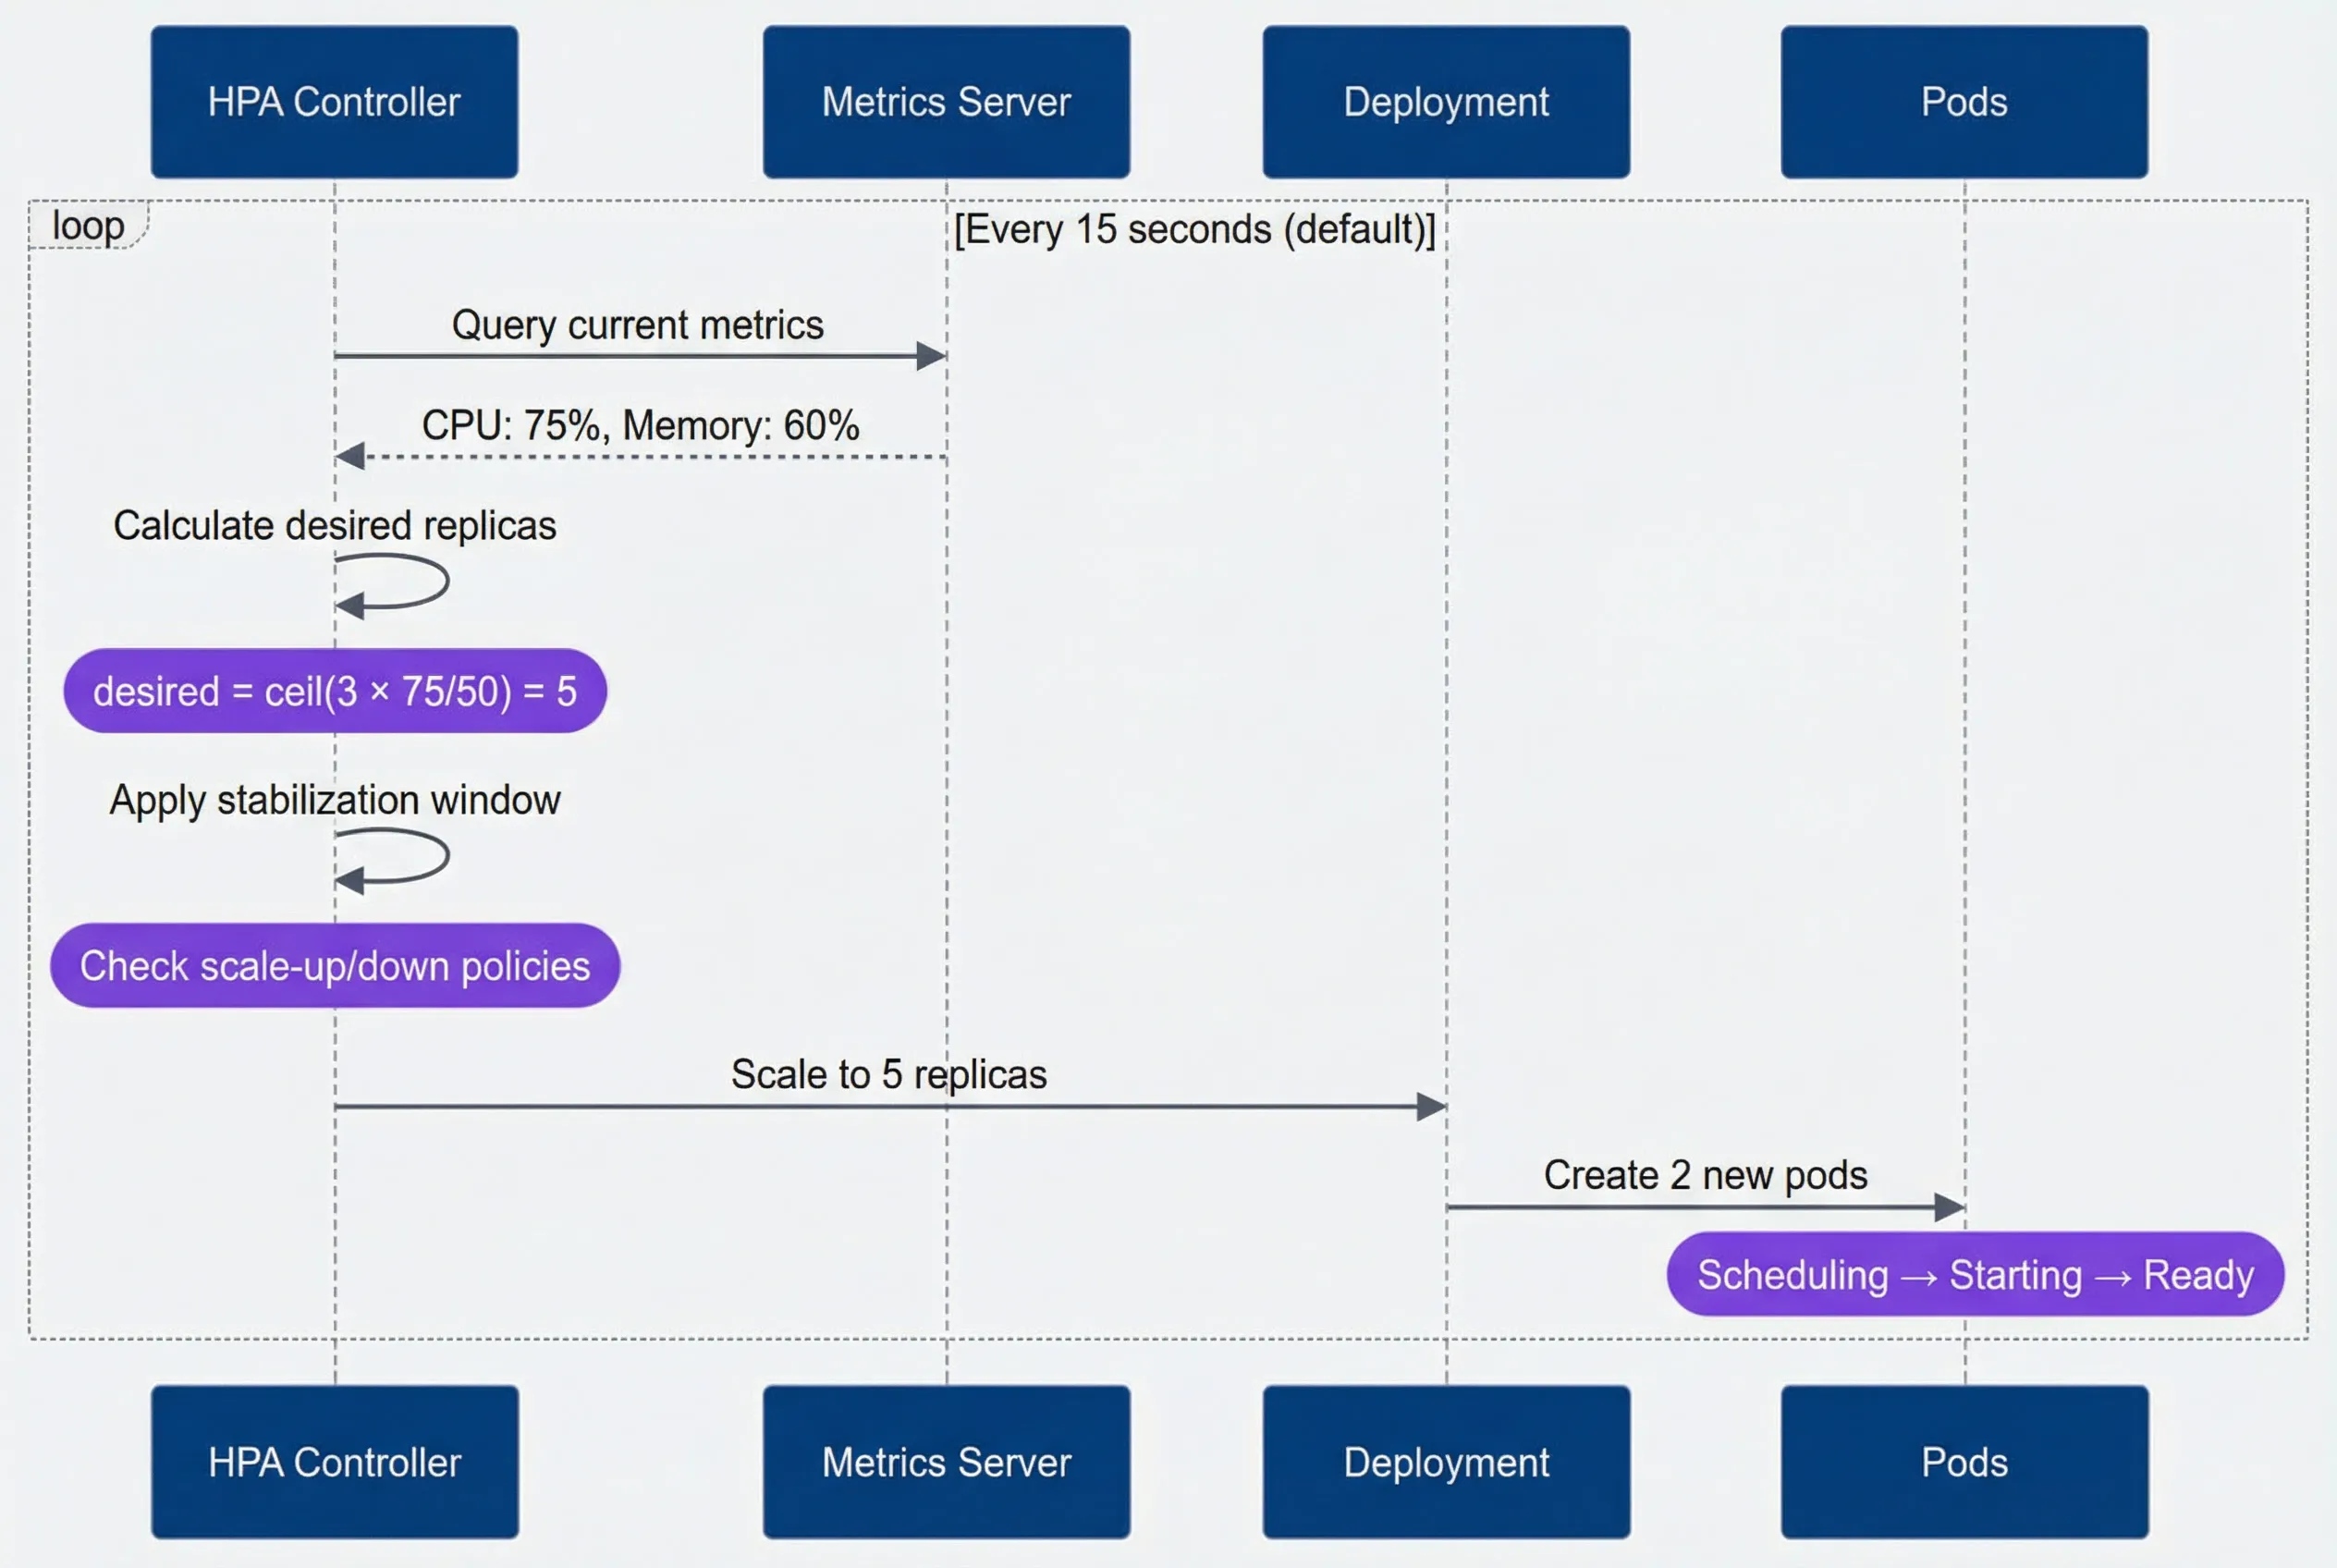
The HPA controller runs a simple loop: every 15 seconds (by default), it queries the metrics server, calculates how many replicas are needed to hit the target utilization, and adjusts the deployment accordingly. The scaling formula is straightforward:
If you have 3 replicas running at 75% CPU with a target of 50%, HPA calculates
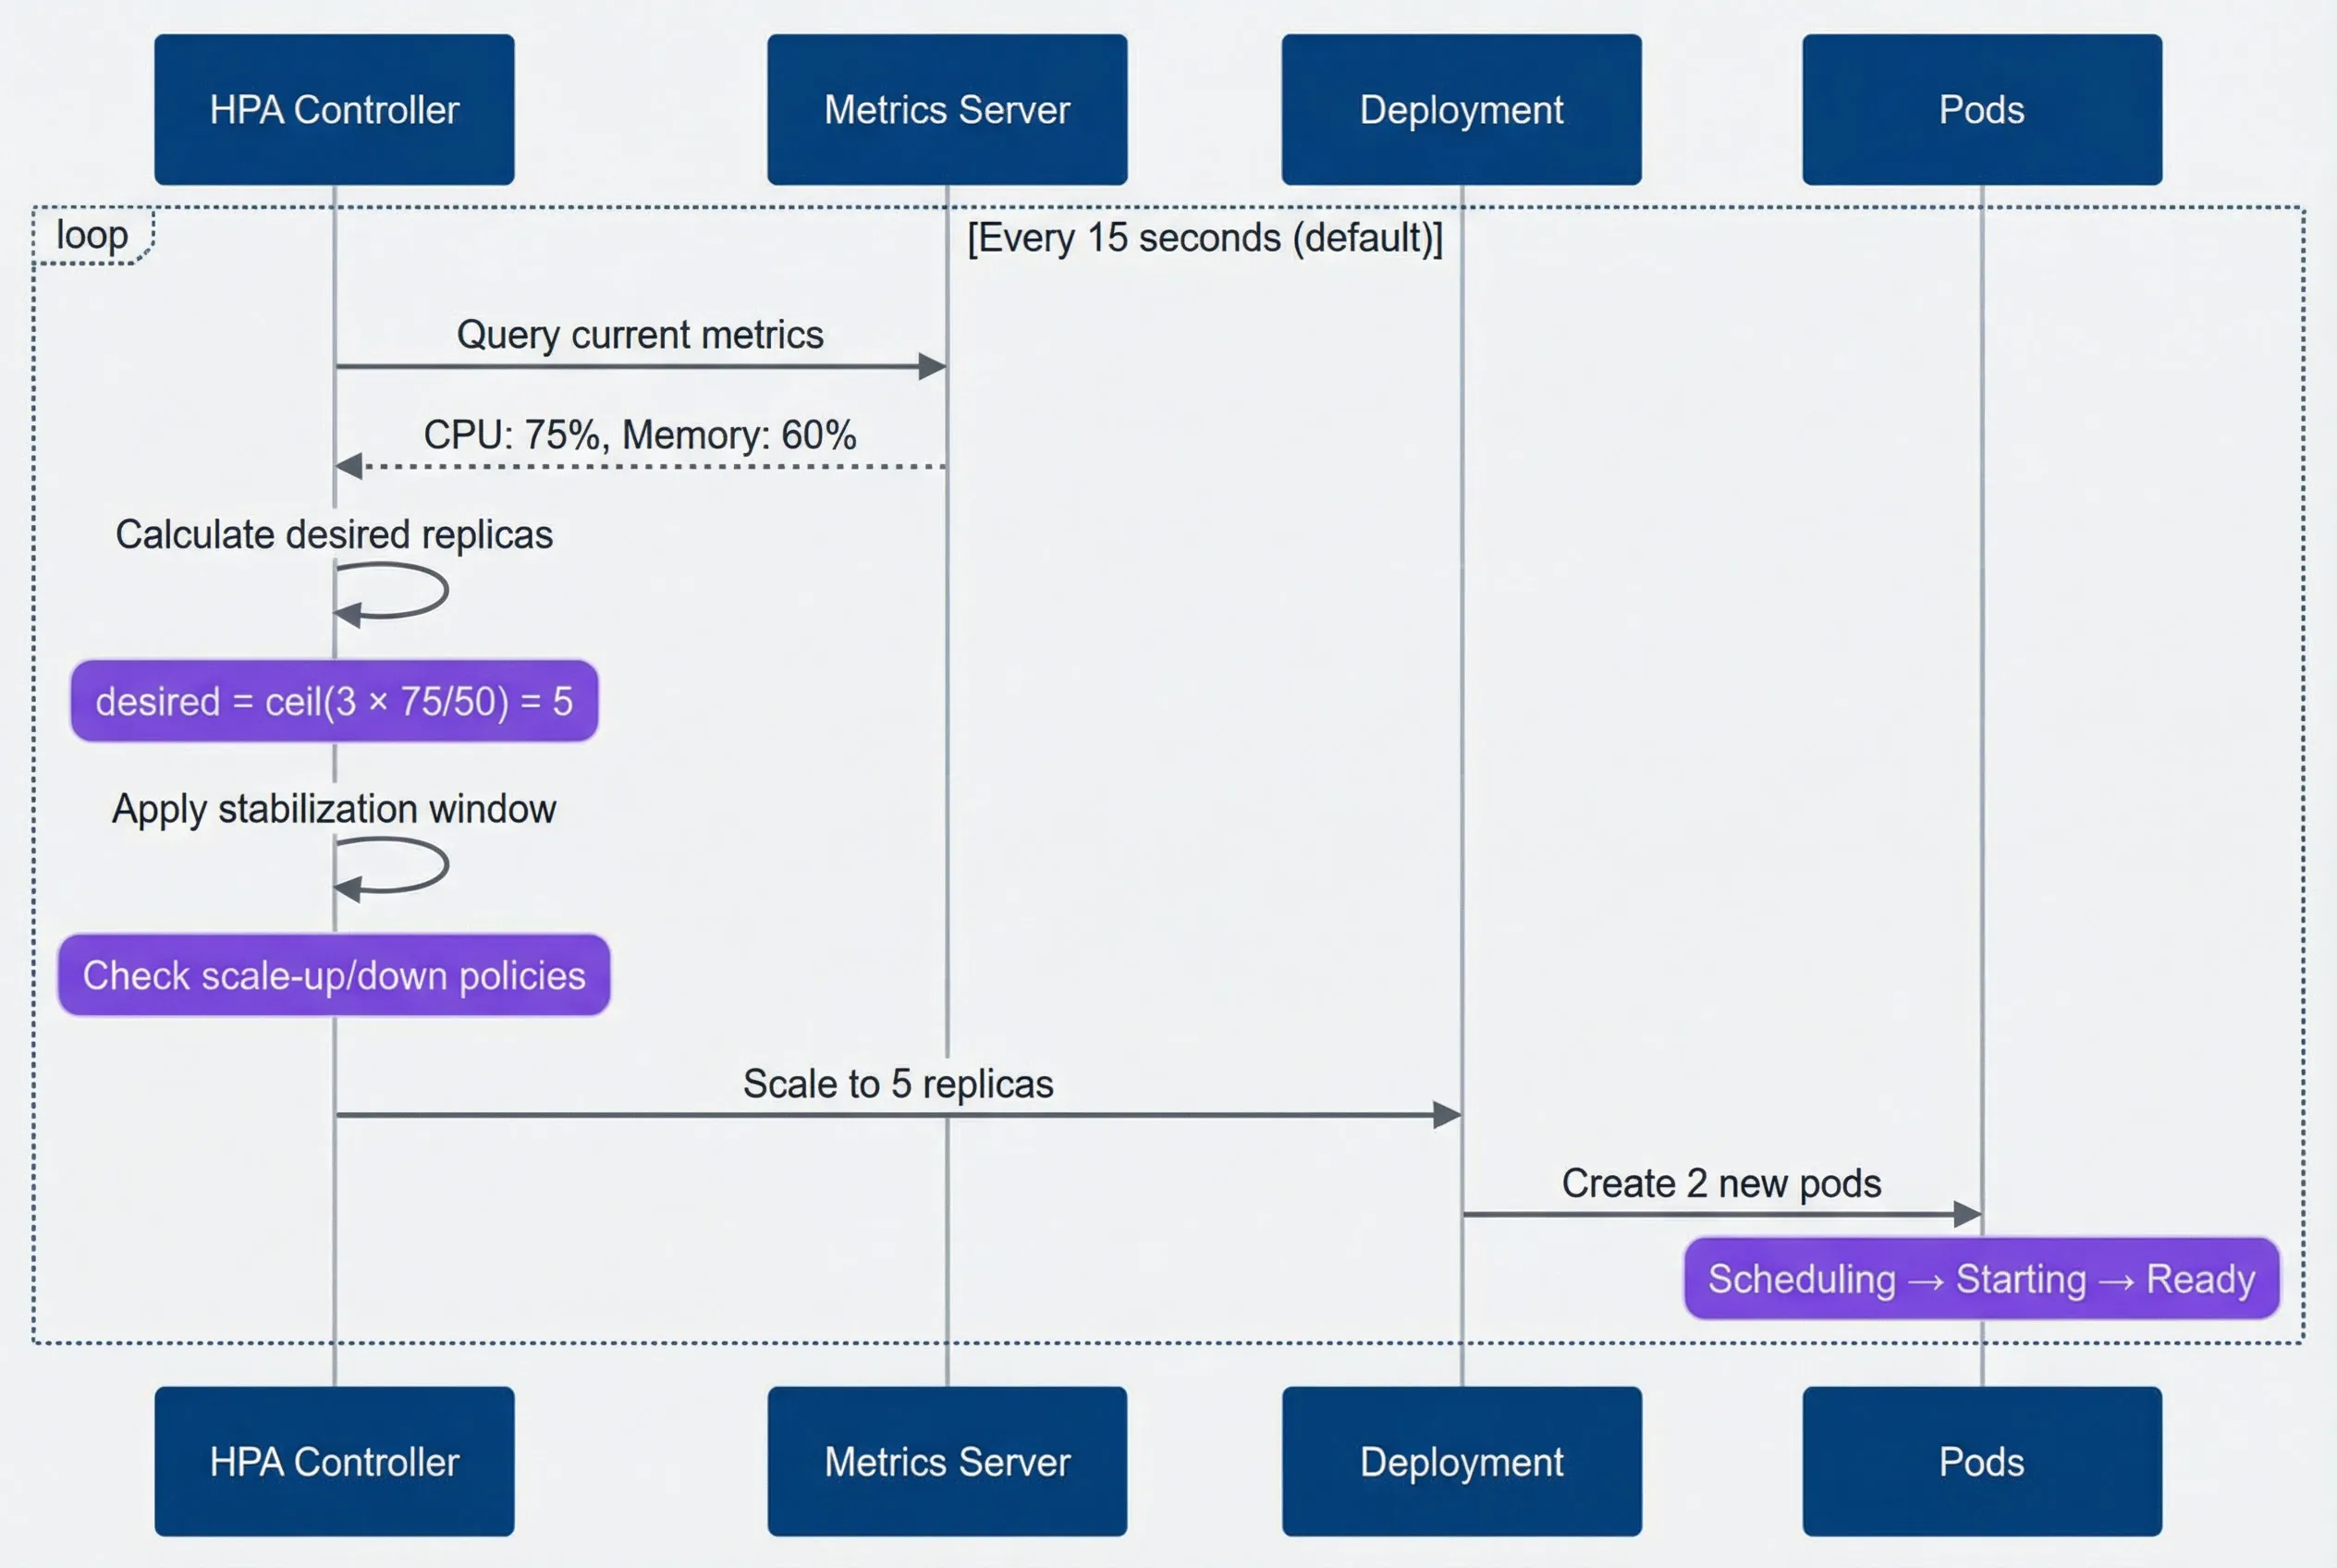
HPA scaling decision flow.description
Sequence diagram showing the Horizontal Pod Autoscaler control loop. The participants are HPA Controller, Metrics Server, Deployment, and Pods. Inside a loop labeled Every 15 seconds by default, the HPA Controller queries the Metrics Server for current metrics, and the Metrics Server returns CPU at 75 percent and Memory at 60 percent. The HPA Controller then calculates desired replicas internally, with a note explaining the formula desired = ceil(3 × 75/50) = 5. Next, the controller applies the stabilization window and checks scale-up or scale-down policies. It then tells the Deployment to scale to 5 replicas, and the Deployment creates 2 new pods. A note over the Pods indicates the lifecycle Scheduling to Starting to Ready. The diagram shows that HPA scaling is a repeated control loop that depends on periodic metrics collection, replica calculation, policy evaluation, and the time it takes for newly created pods to become ready.
A basic HPA configuration targets CPU utilization across all pods. The scaleTargetRef points to the deployment you want to scale, and minReplicas/maxReplicas set the bounds:
apiVersion: autoscaling/v2
kind: HorizontalPodAutoscaler
metadata:
  name: api-server-hpa
  namespace: production
spec:
  scaleTargetRef:
    apiVersion: apps/v1
    kind: Deployment
    name: api-server

  minReplicas: 3
  maxReplicas: 50

  metrics:
    - type: Resource
      resource:
        name: cpu
        target:
          type: Utilization
averageUtilization: 50The 50% target might seem conservative, but it’s intentional. You want headroom to absorb traffic increases while HPA scales up. A target of 80% means you’re already near capacity when HPA decides to act — and by the time new pods are ready, you’ve been overloaded for minutes.
The Delay Problem
The HPA loop sounds fast—15-second intervals — but the total time from “traffic spike begins” to “new capacity receives traffic” is much longer. Every step in the pipeline adds latency.
| Delay Component | Typical Duration | Can Reduce? | How |
|---|---|---|---|
| Metrics scrape | 15-60s | Yes | `--metric-resolution` flag on Metrics Server |
| HPA sync[^hpa-sync] | 15s | Yes | `--horizontal-pod-autoscaler-sync-period` flag |
| Stabilization | 0-300s | Yes | `behavior.scaleUp.stabilizationWindowSeconds` |
| Pod scheduling | 1-10s | Limited | Pre-warmed nodes, pod priority |
| Pod startup | 5-60s+ | Yes | Optimize application startup time |
| Readiness probe | 5-30s | Yes | Tune probe timing |
Here’s a best-case timeline for a traffic spike (assuming 15-second metrics resolution and cached images):
- T+0sTraffic spike begins
- T+15sMetrics server captures the new load
- T+30sHPA evaluates and decides to scale
- T+45sStabilization check passes (assuming aggressive config)
- T+50sNew pods scheduled, images pulled (cached)
- T+80sPods pass readiness probe, receive traffic
That’s 80+ seconds of degraded performance with aggressive tuning and favorable conditions. With default settings — which include a 300-second stabilization window for scale-up in older Kubernetes versions — it’s even worse.
Even with aggressive tuning, the minimum realistic time to scale up is 30-45 seconds. If your traffic can spike faster than that, HPA alone won’t save you. Consider predictive scaling, higher baseline capacity, or request queuing to absorb the delay.
Metric Selection
CPU vs Custom Metrics
The metric you choose determines how quickly HPA reacts — and whether it reacts to the right signal at all. Most teams start with CPU utilization because it’s built-in, but CPU is a lagging indicator: by the time CPU spikes, requests are already queuing. For web services, requests per second or queue depth are leading indicators that increase before your system shows stress.
| Metric Type | Pros | Cons | Best For |
|---|---|---|---|
| CPU utilization | Built-in, no setup; predictable relationship to compute load | Lags behind actual load; doesn't reflect I/O-bound work; misleading for async processing | CPU-intensive APIs, compute workers, synchronous request processing |
| Memory utilization | Built-in; good for memory-intensive workloads | Often doesn't correlate with traffic; stable regardless of load; slow to decrease | In-memory caches, batch processing with large datasets |
| Requests per second | Directly measures load; leading indicator; application-agnostic | Requires custom metrics setup; doesn't account for request complexity | Web APIs, high-traffic services |
| Queue depth | Perfect for async workers; directly measures backlog; leading indicator | Requires custom metrics; threshold needs tuning | Queue consumers, background job processors |
| Response latency | Reflects user experience; catches overload before failure | Lagging indicator; can be noisy; requires custom metrics | SLO-driven scaling, user-facing services |
Custom Metrics with Prometheus
Custom metrics let you scale on application-specific signals instead of generic resource utilization. The setup requires three components: your application exposing metrics, Prometheus scraping them, and an adapter translating Prometheus queries into the Kubernetes custom metrics API.
Custom metrics flow from application to HPA.description
Flowchart showing how application metrics reach the Horizontal Pod Autoscaler through Prometheus-based custom metrics. The main path starts at Application, which exposes a /metrics endpoint to Prometheus. Prometheus sends PromQL queries to Prometheus Adapter. Prometheus Adapter exposes those results through the Custom Metrics API to the HPA Controller. The HPA Controller then scales the Deployment. A separate path shows Metrics Server sending Resource Metrics API data directly to the same HPA Controller. The diagram emphasizes that HPA can consume both standard resource metrics from Metrics Server and custom application metrics translated through Prometheus and Prometheus Adapter before making scaling decisions.
HPA supports three metric types, each suited to different scenarios:
Resource metrics
(CPU, memory): Built-in via Metrics Server. No setup required, but limited to what kubelets report.
Pod metrics
Custom metrics exposed by your application and scraped by Prometheus. Queried per-pod, then averaged.
External metrics
Metrics from outside Kubernetes — queue depths, SaaS API usage, database connections. Useful when scaling should respond to external systems.
Here’s an HPA configuration using all three types. HPA evaluates each metric independently and scales to the highest replica count any metric requests:
apiVersion: autoscaling/v2
kind: HorizontalPodAutoscaler
metadata:
  name: api-server-hpa
  namespace: production
spec:
  scaleTargetRef:
    apiVersion: apps/v1
    kind: Deployment
    name: api-server
  minReplicas: 3
  maxReplicas: 50
  metrics:
    # Pod metric: requests per second
    - type: Pods
      pods:
        metric:
          name: http_requests_per_second
        target:
          type: AverageValue
          averageValue: "100"  # 100 RPS per pod

    # Pod metric: P95 latency
    - type: Pods
      pods:
        metric:
          name: http_request_duration_p95
        target:
          type: AverageValue
          averageValue: "200m"  # 200ms P95 target

    # External metric: queue depth
    - type: External
      external:
        metric:
          name: rabbitmq_queue_messages
          selector:
            matchLabels:
              queue: order-processing
        target:
          type: AverageValue
averageValue: "50" # 50 messages per podThe Prometheus Adapter translates PromQL queries into the custom metrics API format. Each rule maps a Prometheus metric to a Kubernetes resource (namespace, pod) and defines how to query it:
apiVersion: v1
kind: ConfigMap
metadata:
  name: adapter-config
  namespace: custom-metrics
data:
  config.yaml: |
    rules:
      # Convert http_requests_total counter to per-second rate
      - seriesQuery: 'http_requests_total{namespace!="",pod!=""}'
        resources:
          overrides:
            namespace: {resource: "namespace"}
            pod: {resource: "pod"}
        name:
          matches: "^(.*)_total$"
          as: "${1}_per_second"
        metricsQuery: 'sum(rate(<<.Series>>{<<.LabelMatchers>>}[2m])) by (<<.GroupBy>>)'

      # Calculate P95 from histogram buckets
      - seriesQuery: 'http_request_duration_seconds_bucket{namespace!="",pod!=""}'
        resources:
          overrides:
            namespace: {resource: "namespace"}
            pod: {resource: "pod"}
        name:
          as: "http_request_duration_p95"
metricsQuery: 'histogram_quantile(0.95, sum(rate(<<.Series>>{<<.LabelMatchers>>}[2m])) by (le, <<.GroupBy>>))'The [2m] window in the PromQL queries smooths out brief spikes. A shorter window (30 seconds) makes scaling more responsive but increases oscillation risk. A longer window (5 minutes) stabilizes scaling but delays reaction to genuine load changes. Two minutes is a reasonable starting point.
When possible, scale on leading indicators (RPS, queue depth) rather than lagging ones (CPU, latency). By the time CPU spikes, requests are already queuing.
HPA Behavior Configuration
Stabilization and Scaling Policies
The behavior field in HPA v2 gives you fine-grained control over scaling speed. Two mechanisms work together: stabilization windows prevent thrashing by requiring metrics to stay above/below thresholds for a duration before acting, and scaling policies limit how many replicas can be added or removed per time period.
The key insight is that scaling up and scaling down should be asymmetric. When traffic spikes, you want capacity now — waiting costs customer experience. When traffic drops, you want to wait — scaling down too fast means you’ll scale right back up if traffic returns, wasting the pods you just terminated.
apiVersion: autoscaling/v2
kind: HorizontalPodAutoscaler
metadata:
  name: api-server-hpa
  namespace: production
spec:
  scaleTargetRef:
    apiVersion: apps/v1
    kind: Deployment
    name: api-server
  minReplicas: 3
  maxReplicas: 50
  metrics:
    - type: Resource
      resource:
        name: cpu
        target:
          type: Utilization
          averageUtilization: 50
  behavior:
    scaleUp:
      stabilizationWindowSeconds: 0        # Scale immediately
      policies:
        - type: Percent
          value: 100                        # Double capacity
          periodSeconds: 15
        - type: Pods
          value: 4                          # Or add 4 pods
          periodSeconds: 15
      selectPolicy: Max                     # Use whichever adds more

    scaleDown:
      stabilizationWindowSeconds: 300       # Wait 5 minutes
      policies:
        - type: Percent
          value: 10                         # Remove 10% of pods
          periodSeconds: 60
        - type: Pods
          value: 2                          # Or remove 2 pods
          periodSeconds: 60
selectPolicy: Min # Use whichever removes fewerThe selectPolicy field determines how HPA chooses between multiple policies:
- Max:
- Use the policy that results in the largest change. For scale-up, this means adding the most pods. Good for aggressive scaling.
- Min:
- Use the policy that results in the smallest change. For scale-down, this means removing the fewest pods. Good for conservative scaling.
- Disabled:
- Don't scale in this direction at all.
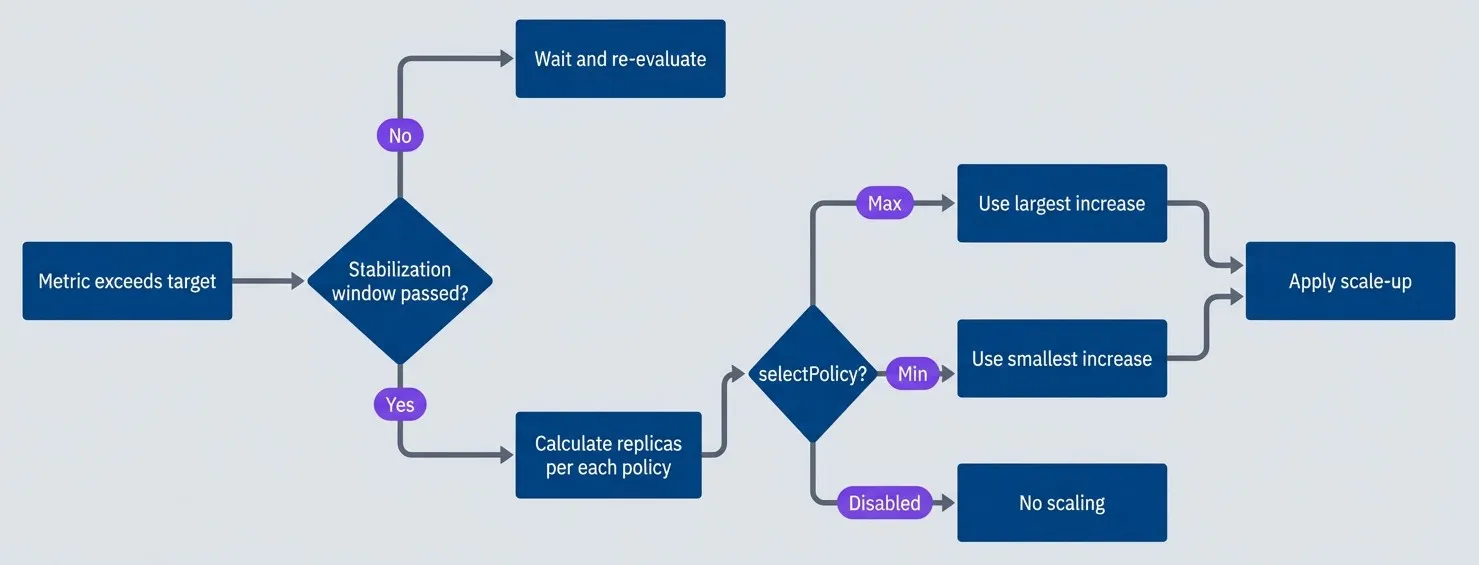
HPA policy selection flow.description
Flowchart showing how HPA decides whether and how to scale after a metric exceeds its target. The process starts at Metric exceeds target and moves to a decision asking whether the stabilization window has passed. If no, the flow goes to Wait and re-evaluate. If yes, the flow moves to Calculate replicas per each policy. From there, a decision asks for the selectPolicy setting. If the value is Max, the chart goes to Use largest increase. If the value is Min, it goes to Use smallest increase. If the value is Disabled, it goes to No scaling. The Max and Min branches both lead to Apply scale-up. The diagram shows that HPA does not act on raw metrics alone: it first waits for stabilization rules, then compares scaling policies, then applies the policy selected by the configuration.
Common Behavior Patterns
Different traffic patterns call for different behavior configurations. The tradeoff is always between responsiveness (scale fast to handle spikes) and stability (avoid oscillation and wasted resources).
| # | Pattern | Use Case | Scale-Up | Scale-Down | Tradeoff |
|---|---|---|---|---|---|
| 1 | Fast response | Flash sales, viral content | 0s stabilization, 200%/15s, Max | 300s stabilization, 10%/60s, Min | May over-provision, higher cost |
| 2 | Stable traffic | Business hours, scheduled jobs | 60s stabilization, 50%/60s, Max | 600s stabilization, 20%/120s, Min | Slower response, more stable |
| 3 | Cost optimized | Batch processing, internal tools | 60s stabilization, 2 pods/60s, Min | 120s stabilization, 50%/60s, Max | May degrade during spikes, lower cost |
| 4 | Never scale down | Always-on services | Normal policies | 0 pods/60s (effectively disabled) | Maximum availability, maximum cost |
For flash sales or viral traffic, you want the most aggressive scale-up possible. Zero stabilization means HPA acts on the first evaluation that shows high load. A 200% policy means you can double capacity every 15 seconds — going from 5 to 10 to 20 to 40 pods in under a minute if needed:
behavior:
  scaleUp:
    stabilizationWindowSeconds: 0
    policies:
      - type: Percent
        value: 200
        periodSeconds: 15
    selectPolicy: Max
  scaleDown:
    stabilizationWindowSeconds: 300
    policies:
      - type: Percent
        value: 10
        periodSeconds: 60
selectPolicy: MinFor predictable business-hours traffic, you can afford slower scaling. A 60-second stabilization window filters out brief metric noise, and a 50% scale-up rate is fast enough to handle gradual morning ramp-up without over-provisioning:
behavior:
  scaleUp:
    stabilizationWindowSeconds: 60
    policies:
      - type: Percent
        value: 50
        periodSeconds: 60
    selectPolicy: Max
  scaleDown:
    stabilizationWindowSeconds: 600
    policies:
      - type: Percent
        value: 20
        periodSeconds: 120
selectPolicy: MinThe pattern of aggressive scale-up and conservative scale-down fits most workloads. Over-provisioning wastes money; under-provisioning loses customers. When in doubt, err on the side of too much capacity. You can always tune down the aggressiveness once you understand your traffic patterns.
Tuning for Traffic Patterns
The “right” HPA configuration depends entirely on your traffic. An e-commerce site with predictable business-hours traffic needs different settings than a social platform that might go viral at any moment. Generic configurations either scale too slowly for spiky traffic or waste money on stable traffic. Understanding your traffic patterns lets you tune HPA for your specific tradeoffs.
Traffic Pattern Analysis
Before tuning HPA, you need to understand your traffic. Four characteristics matter most:
- 1Peak-to-trough ratioHow much does traffic vary? A 3x ratio (business hours vs night) is manageable. A 20x ratio (flash sale) requires aggressive scaling.
- 2Ramp-up timeHow fast does traffic increase? Gradual morning ramp-up over an hour is easy. A spike in 10 seconds is hard.
- 3PredictabilityDo you know when traffic will increase? Scheduled events can be pre-scaled. Random viral content cannot.
- 4Spike frequencyRare spikes justify aggressive over-provisioning. Frequent spikes need tighter cost control.
These characteristics map to specific HPA strategies. The table below shows common traffic patterns and the scaling approaches that work best for each:
| Traffic Type | Peak:Trough | Ramp-Up | Predictable | Recommended Strategy |
|---|---|---|---|---|
| Business hours | 2-5x | 1-2 hours | Yes | Scheduled pre-scaling + moderate HPA |
| Flash sales | 10-50x | Seconds | Yes | Aggressive pre-scaling + fast HPA |
| Viral content | 5-100x | Minutes | No | High baseline + aggressive HPA |
| Steady API | 1.5-2x | Gradual | N/A | Standard HPA, optimize for cost |
The key insight is that HPA alone can’t handle instantaneous spikes. If traffic can increase 10x in 10 seconds, you need capacity already running when the spike hits. HPA’s role becomes handling the variance around your pre-provisioned baseline, not catching up from zero.
Combining HPA with Scheduled Scaling
For predictable traffic patterns, combine HPA with scheduled scaling. KEDA (Kubernetes Event-Driven Autoscaling) supports cron triggers that set minimum replica counts at specific times, while HPA handles real-time adjustments within those bounds.
apiVersion: keda.sh/v1alpha1
kind: ScaledObject
metadata:
  name: api-server-scaler
  namespace: production
spec:
  scaleTargetRef:
    name: api-server
  minReplicaCount: 3
  maxReplicaCount: 50
  triggers:
    # Baseline: CPU-based reactive scaling
    - type: cpu
      metadata:
        type: Utilization
        value: "50"

    # Pre-scale for business hours (8 AM Mon-Fri)
    - type: cron
      metadata:
        timezone: America/New_York
        start: "0 8 * * 1-5"
        end: "0 9 * * 1-5"
        desiredReplicas: "10"

    # Pre-scale for known flash sale (15th of month)
    - type: cron
      metadata:
        timezone: America/New_York
        start: "0 11 15 * *"
        end: "0 15 15 * *"
desiredReplicas: "30"If you don’t have KEDA, a simple CronJob can pre-scale deployments before known traffic events:
apiVersion: batch/v1
kind: CronJob
metadata:
  name: prescale-for-business-hours
  namespace: production
spec:
  schedule: "0 7 * * 1-5"  # 7 AM Mon-Fri, 1 hour before peak
  jobTemplate:
    spec:
      template:
        spec:
          serviceAccountName: scaler-sa  # Needs patch permissions
          containers:
            - name: scaler
              image: bitnami/kubectl:latest
              command: ["kubectl", "scale", "deployment/api-server",
                        "--replicas=10", "-n", "production"]
restartPolicy: OnFailureThe pattern is simple: pre-scale 30-60 minutes before expected traffic, then let HPA handle the actual load. If your prediction was low, HPA scales up. If your prediction was high, HPA (eventually) scales down. Either way, you’re not scrambling to add capacity while users wait.
If you know traffic is coming — a sale, a marketing campaign, a TV appearance — pre-scale. HPA’s job is handling unexpected variance, not catching up to traffic you knew about. The 30-90 second HPA response time is unacceptable when you could have had pods ready hours in advance.
Debugging HPA Issues
HPA failures are frustrating because they’re often silent — you don’t notice until traffic spikes and capacity doesn’t follow. The good news is that HPA exposes its decision-making through kubectl describe hpa, and most problems fall into a few categories: metrics unavailable, scaling too slow, oscillating, or not scaling down.
Common Problems and Solutions
Problem: HPA stuck at minReplicas despite high load
This usually means HPA can’t see your metrics. Check the Conditions section in kubectl describe hpa—look for “unable to get metrics” or “AbleToScale: False”. The most common causes:
- Metrics Server not running or unhealthy
- Pods missing resource requests (HPA can't calculate utilization without knowing the baseline)
- Custom metrics adapter not configured for non-CPU metrics
# Check if metrics are available
kubectl top pods -n production

# Check metrics server health
kubectl get apiservices | grep metrics

# Verify pods have resource requests
kubectl get pod <pod-name> -o jsonpath='{.spec.containers[*].resources.requests}'Problem: HPA oscillates rapidly between replica counts
Thrashing — scaling up, then immediately scaling down, then up again — indicates either too-short stabilization windows or too-aggressive targets. Watch the replica count over time:
# Watch HPA changes in real-time
kubectl get hpa api-server-hpa -n production -w

# Check recent scaling events
kubectl describe hpa api-server-hpa -n production | grep -A 20 "Events:"Fixes: Increase stabilizationWindowSeconds (especially for scale-down), lower the target utilization (50% instead of 80%), or smooth your metrics with longer averaging windows in your Prometheus queries.
Problem: HPA scales too slowly for traffic spikes
If HPA is working but not fast enough, check the behavior configuration. Default stabilization windows (especially the 300-second scale-up window in older Kubernetes versions) add significant delay.
# Check current behavior configuration
kubectl get hpa api-server-hpa -n production -o yaml | grep -A 30 "behavior:"

# Check last scale time
kubectl describe hpa api-server-hpa -n production | grep "Last Scale Time"Fixes: Set scaleUp.stabilizationWindowSeconds: 0, increase scale-up policy percentages, optimize pod startup time, or raise minReplicas to maintain headroom.
Problem: HPA never scales down
Pods sitting idle waste money. If HPA won’t scale down even when load is low, check whether scale-down is accidentally disabled or the stabilization window is extremely long.
# Check scale-down policies
kubectl get hpa api-server-hpa -n production -o jsonpath='{.spec.behavior.scaleDown}' | jq .

# Verify metrics are actually below target
kubectl get hpa api-server-hpa -n productionLook for selectPolicy: Disabled in scale-down, or a policy with value: 0 that prevents any pod removal.
Debugging Decision Tree
When HPA isn’t behaving as expected, work through this diagnostic flow:
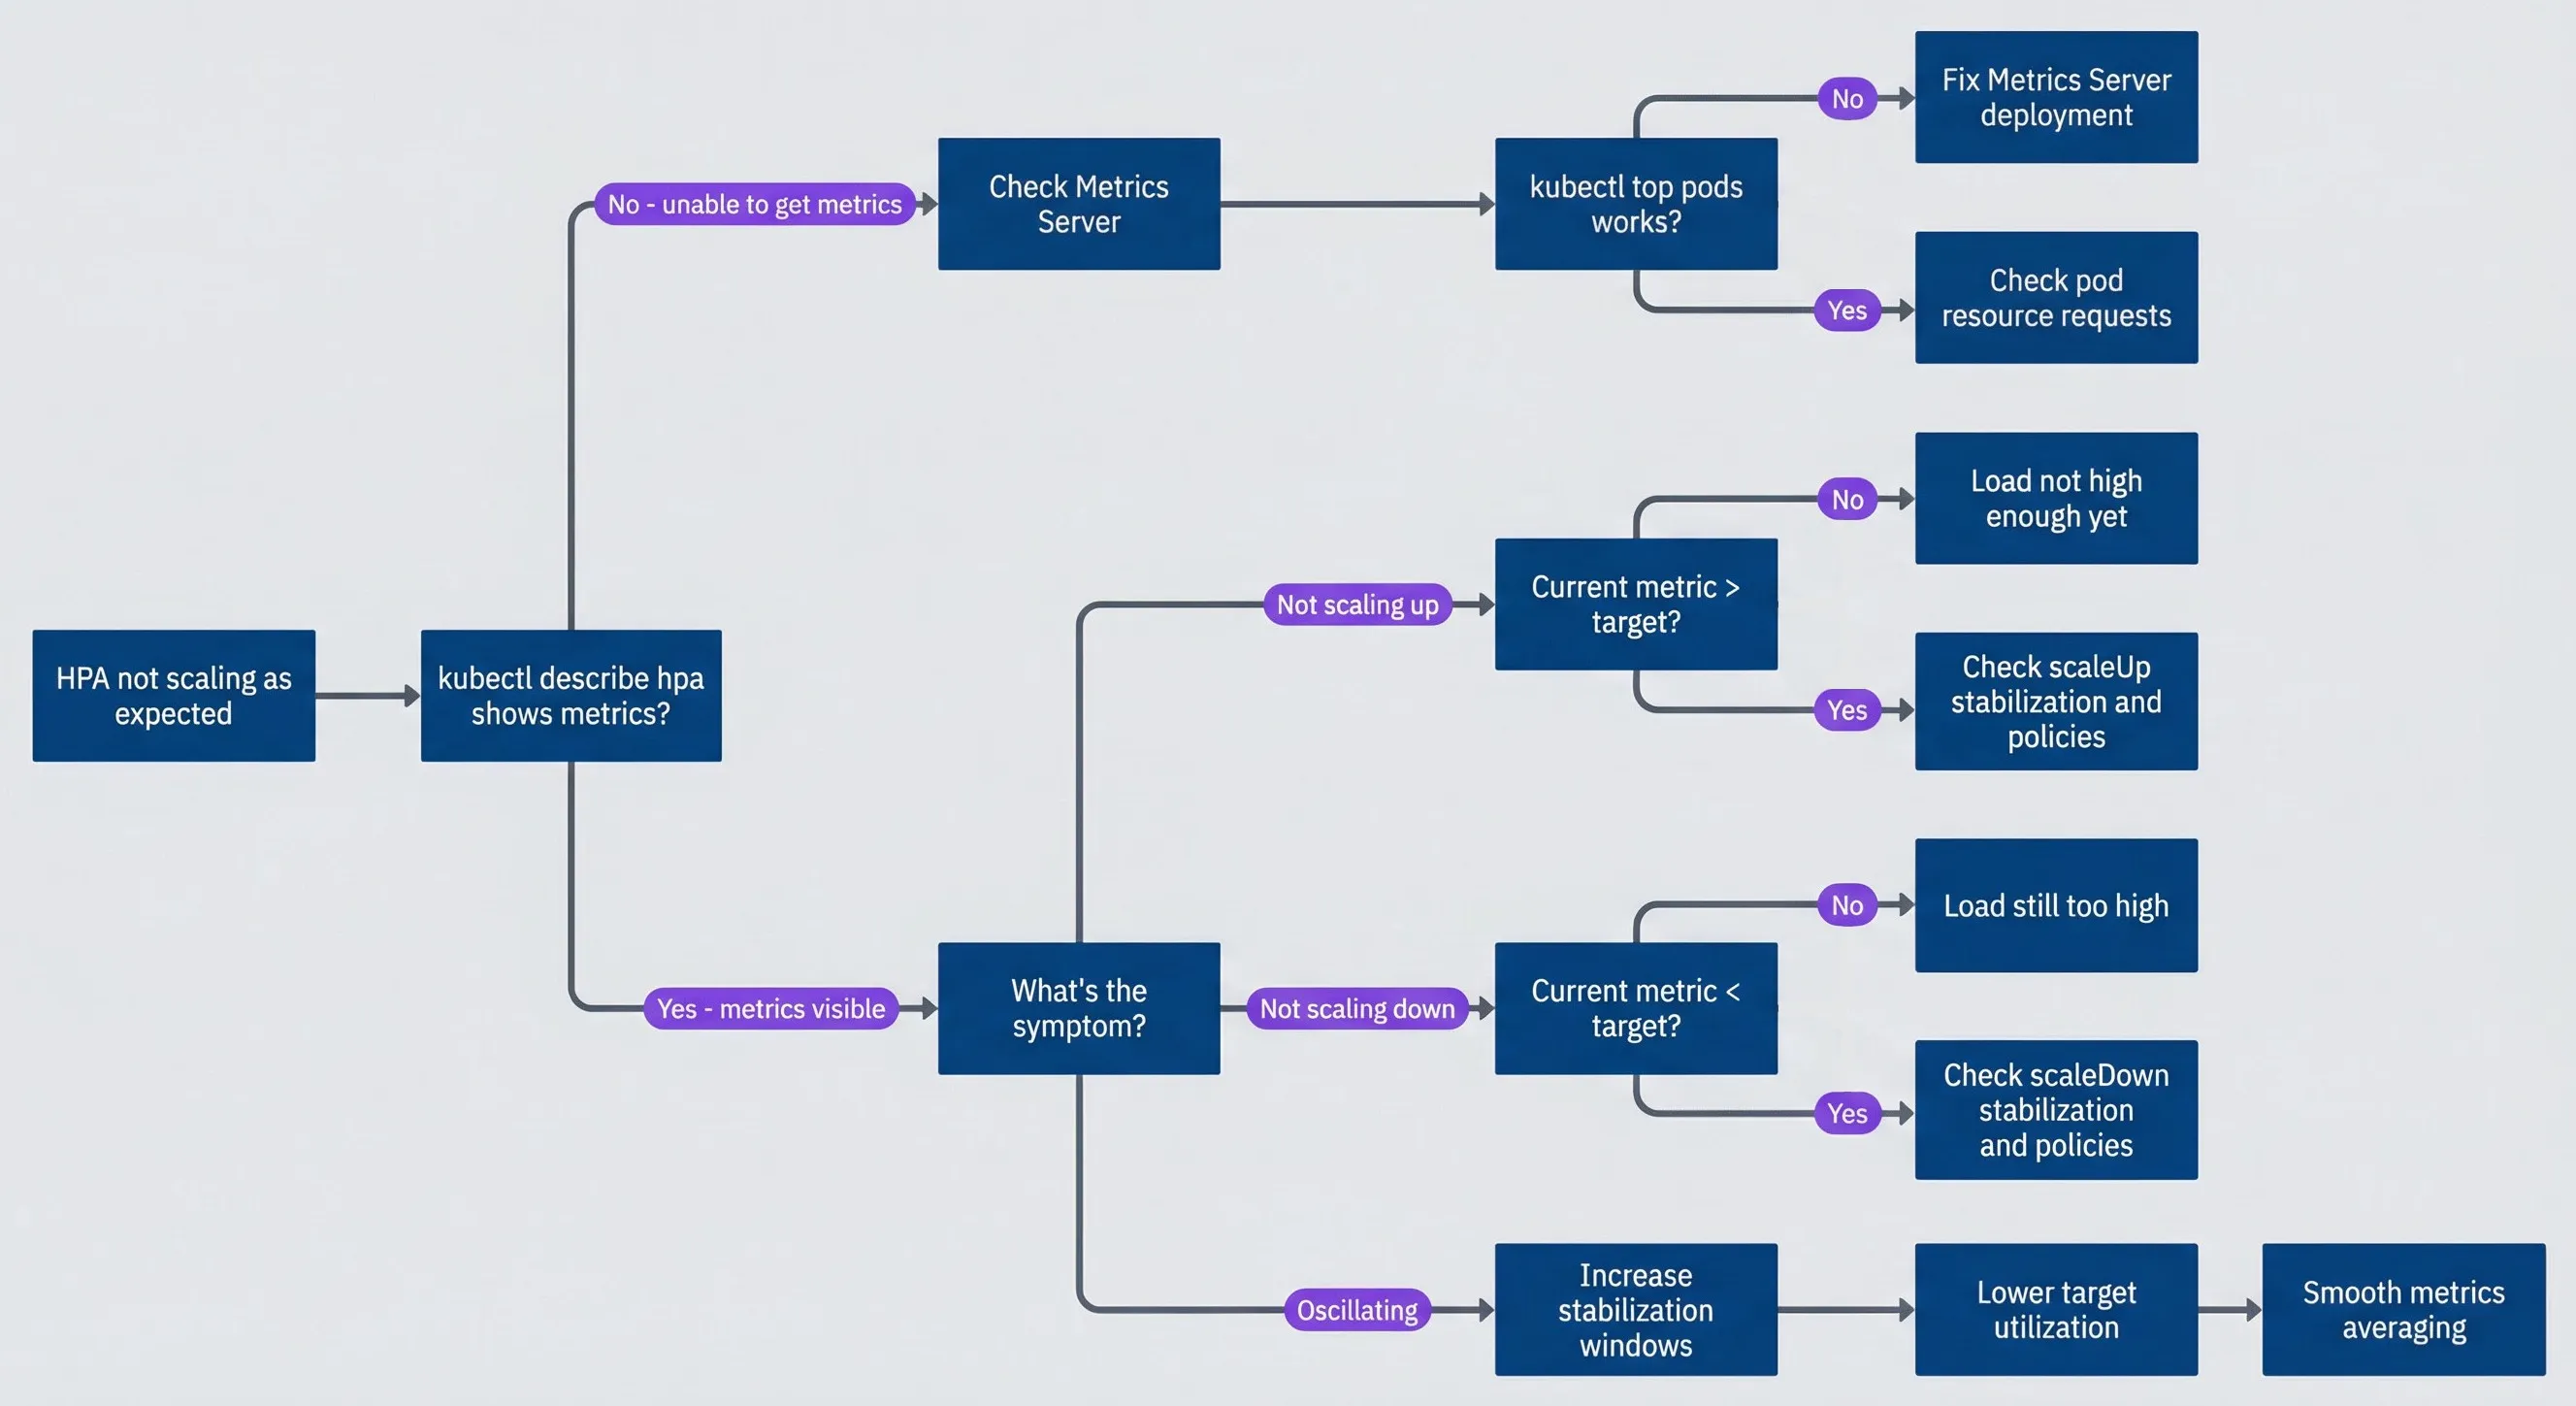
HPA debugging decision tree.description
Flowchart showing a troubleshooting path for HPA behavior problems. The process starts at HPA not scaling as expected and first asks whether kubectl describe hpa shows metrics. If no and the message says unable to get metrics, the path goes to Check Metrics Server and then asks whether kubectl top pods works. If that answer is no, the next step is Fix Metrics Server deployment. If yes, the next step is Check pod resource requests. If metrics are visible, the chart asks what the symptom is. For Not scaling up, it asks whether the current metric is above target. If no, the result is Load not high enough yet. If yes, the next step is Check scaleUp stabilization and policies. For Not scaling down, it asks whether the current metric is below target. If no, the result is Load still too high. If yes, the next step is Check scaleDown stabilization and policies. For Oscillating, the path proceeds through Increase stabilization windows, then Lower target utilization, then Smooth metrics averaging. The diagram is meant to guide an operator from a visible scaling symptom to the most likely configuration or metrics problem.
Essential Debugging Commands
These commands cover most HPA debugging scenarios:
#!/bin/bash

HPA="api-server-hpa"
NS="production"

# Quick status check
kubectl get hpa $HPA -n $NS

# Full details including conditions and events
kubectl describe hpa $HPA -n $NS

# Current metrics in JSON format
kubectl get hpa $HPA -n $NS -o jsonpath='{.status.currentMetrics}' | jq .

# Scaling history from events
kubectl get events -n $NS \
  --field-selector involvedObject.name=$HPA \
  --sort-by='.lastTimestamp' | tail -15

# Current pod resource usage
kubectl top pods -n $NS -l app=api-serverThe Conditions section of kubectl describe hpa tells you exactly why HPA is or isn’t scaling. “AbleToScale: False” means metrics problems. “ScalingLimited” means policy or min/max constraints. “ScalingActive: True” with no changes means the current replica count already matches the target. Start there before digging deeper.
Advanced Patterns
Standard HPA covers most use cases, but some scenarios require more sophisticated approaches: combining multiple metrics so any bottleneck triggers scaling, scaling to zero for idle workloads, or handling event-driven architectures where traditional metrics don’t apply.
Multi-Metric HPA
HPA can evaluate multiple metrics simultaneously. When you configure several metrics, HPA calculates the desired replica count for each and uses the maximum — the metric requiring the most replicas wins. This ensures you scale up when any resource becomes constrained, not just one.
apiVersion: autoscaling/v2
kind: HorizontalPodAutoscaler
metadata:
  name: api-server-hpa
  namespace: production
spec:
  scaleTargetRef:
    apiVersion: apps/v1
    kind: Deployment
    name: api-server
  minReplicas: 3
  maxReplicas: 50
  metrics:
    # CPU: catches compute-bound bottlenecks
    - type: Resource
      resource:
        name: cpu
        target:
          type: Utilization
          averageUtilization: 50

    # RPS: catches request-heavy scenarios before CPU spikes
    - type: Pods
      pods:
        metric:
          name: http_requests_per_second
        target:
          type: AverageValue
          averageValue: "100"

    # Latency: catches degraded performance regardless of cause
    - type: Pods
      pods:
        metric:
          name: http_request_duration_p99_seconds
        target:
          type: AverageValue
averageValue: "500m" # Scale if P99 > 500msHere’s how the calculation works. Suppose current state is 5 replicas:
- CPU metric: 60% utilization, target 50% →
replicas - RPS metric: 120 RPS/pod, target 100 →
replicas - Latency metric: 400ms P99, target 500ms →
replicas
HPA takes the maximum: 6 replicas. The latency metric calculates fewer replicas than currently running (4 < 5), which would suggest scaling down if it were the only metric — but CPU and RPS both want more capacity, so we scale up. This “max wins” behavior ensures you don’t under-provision when any metric indicates stress.
This pattern is particularly useful for services with mixed workloads — some requests are CPU-heavy, others are I/O-heavy. A single metric might miss bottlenecks that only affect certain request types.
KEDA for Event-Driven Scaling
KEDA (Kubernetes Event-Driven Autoscaling) extends HPA with two capabilities standard HPA lacks: scaling to zero, and scaling on external event sources like message queues, databases, or cloud services.
For queue-based workers, KEDA scales based on queue depth rather than pod metrics. When the queue is empty, KEDA can scale to zero pods, saving resources. When messages arrive, KEDA spins up pods to process them:
apiVersion: keda.sh/v1alpha1
kind: ScaledObject
metadata:
  name: order-processor-scaler
  namespace: production
spec:
  scaleTargetRef:
    name: order-processor
  minReplicaCount: 1
  maxReplicaCount: 100
  idleReplicaCount: 0           # Scale to zero when idle
  cooldownPeriod: 300           # Wait 5 min before scaling to zero
  pollingInterval: 15           # Check queue every 15s
  triggers:
    - type: rabbitmq
      metadata:
        host: amqp://rabbitmq.messaging:5672
        queueName: orders
        mode: QueueLength
        value: "10"             # Target 10 messages per pod
    - type: rabbitmq
      metadata:
        host: amqp://rabbitmq.messaging:5672
        queueName: orders
        mode: MessageRate
        value: "50"             # Also consider message arrival rate
KEDA also supports Prometheus as a trigger source, letting you scale on any metric Prometheus collects — including business metrics like active users or transaction volume:
apiVersion: keda.sh/v1alpha1
kind: ScaledObject
metadata:
  name: api-scaler
  namespace: production
spec:
  scaleTargetRef:
    name: api-server
  minReplicaCount: 3
  maxReplicaCount: 50
  triggers:
    - type: prometheus
      metadata:
        serverAddress: http://prometheus.monitoring:9090
        threshold: "100"
query: sum(rate(http_requests_total{deployment="api-server"}[2m]))The key difference from standard HPA with Prometheus Adapter is KEDA’s native support for scale-to-zero and its simpler configuration for external sources. If you need either capability, KEDA is the standard solution.
Use KEDA when you need scale-to-zero (queue workers, batch jobs, dev environments) or when scaling on external sources (message queues, databases, cloud service metrics). For standard CPU/memory/custom-metrics scaling without scale-to-zero, native HPA is simpler and has fewer moving parts.
Conclusion
HPA tuning comes down to four principles:
- 1Understand the delays.The path from "traffic spike" to "new pod serving requests" includes metrics collection (15-60s), HPA sync (15s), stabilization windows (0-300s), pod scheduling (1-10s), container startup (5-60s), and readiness probes (5-30s). With defaults, you're looking at 90+ seconds minimum. Aggressive tuning can get you to 30-45 seconds, but no faster. If your traffic can spike harder than that, HPA alone won't save you.
- 2Choose leading indicators.CPU and latency are lagging indicators — they show problems that already exist. Requests per second and queue depth are leading indicators — they spike the moment traffic arrives, before your system shows stress. Scale on what's coming, not what's already hurting.
- 3Scale up fast, scale down slow.The asymmetric pattern fits most workloads: zero stabilization on scale up so you respond immediately, 5+ minute stabilization on scale down so you don't thrash. Over-provisioning costs money. Under-provisioning loses customers. When in doubt, err toward more capacity.
- 4Pre-scale for known events.HPA handles unexpected variance. It shouldn't be catching up to traffic you knew about. Flash sales, marketing campaigns, scheduled batch jobs — pre-scale hours in advance with cron triggers or KEDA. Let HPA handle the variance around your pre-provisioned baseline.
The best HPA configuration is one you never think about. Traffic varies, capacity adjusts, users don’t notice. Getting there requires measuring actual behavior — not guessing at configurations. Instrument your HPA, watch its scaling decisions under real load, and tune based on data. The article’s examples are starting points, not destinations.
The tuning process is iterative. Start with defaults, run under real load, and watch what happens. If you’re scaling too slowly, reduce stabilization windows and increase policy percentages. If you’re oscillating, increase stabilization and lower your target utilization. If you’re wasting money on idle pods, tighten scale-down policies or raise target utilization. There’s no universal “best” configuration — only the configuration that matches your traffic pattern.
Sharethisarticle
Enjoyed the read? Share it with your network.




