Measuring Platform Success: Metrics That Matter
Free Download
Get the ebook instantly. Review the outline, enter your work email, and open the download in one step.
Lead time, onboarding time, and ticket deflection metrics that show whether your platform reduces friction.
- File type
- PDF Download
- Pages
- 16 pages
- File size
- 1.0 MB
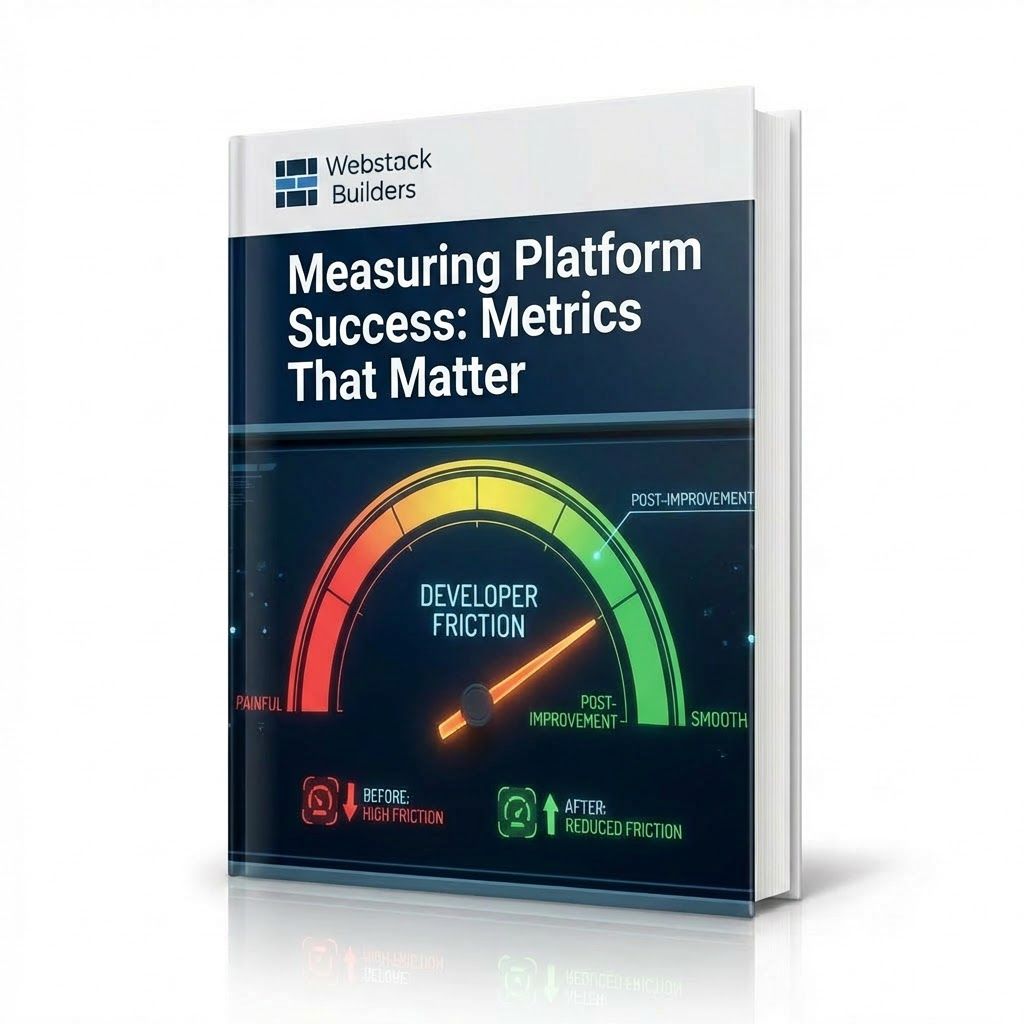
A platform team built an internal developer portal with self-service infrastructure provisioning, then faced the measurement gap: easy to fund when novel, hard to justify when mature. Leadership asked: “Did we save money? Are developers faster?” The team measured platform activity (500 developers onboarded, 10,000 API calls, 99.9% uptime) but couldn’t answer what really mattered. The pivot was friction-focused metrics — time to first deployment dropped from 2 weeks to 2 hours, infrastructure tickets per developer dropped 80%, developer NPS rose from -20 to +45. The narrative became clear: “Developers are 10x faster and need 80% less support.”
Meaningful platform metrics answer one question: is the platform making developers more productive?
This complete guide teaches you:
- Lead time metrics: time to first deployment, service creation, and deployment lead time
- Friction metrics: ticket volume, self-service rate, and cognitive load
- Reliability indicators: failed deployments, rollback frequency, and mean time to recovery
- Developer satisfaction: NPS, CSAT, and qualitative feedback
- DORA framework: deployment frequency and industry benchmarks
- Observability for platform metrics: measuring from systems and surveys
- Comparative analysis: tracking improvement over time
- Communicating platform value to leadership and stakeholders
Download Your Platform Metrics Guide now to measure whether your platform actually reduces developer friction.
Instant Access
Get The Ebook
Fill out the form below to receive your pdf instantly.